Innovation in inflationary times Part 3
A playbook for innovation leaders in the CPG/FMCG industry

Article series
Inflation
Inflationary time is a challenging time as innovation leaders face choices to either completely redraw their pipeline, launch inflation resilient innovations, or renovate to reduce pricing vulnerability. In the last 2 weeks we have discussed how to make an inflation resilient innovation pipeline, and how to choose between increasing price, downsize, and cost reduction. This week let’s talk about how to understand your pricing landscape, understanding how inflation might impact your category/segment, and how to find the right space for your next innovation.
Understanding category price elasticity*
Large categorical demand drop during inflation is a dreaded scenario for brand managers planning innovations or renovations. However, not all categories react to inflation in universal ways, some are more resilient than others.
For example, In the 2001-2002 period, both Turkey and Argentina experienced dramatic consumer price increases triggered by currency fluctuation under a global backdrop of economic instability. Turkish consumer spending on Food & Beverage shrank 17% in 2001 vs. 2000 (in constant exchange rate)2. However, not all categories are hit equally, while packaged meat suffered a whopping 31% hit, packaged dairy products were relatively unscathed at an 8% loss. Similarly, while Personal care overall sustained an 11% decrease, paper products (6% decrease) were relatively unharmed compared to Haircare (16% decrease). Meanwhile in Argentina, comparing 2002 to 2000, Tea and Butter had a modest 2-5% decrease in consumption while mineral water and packaged snacks saw a mind-boggling 40% loss3.
To understand where your category might land on the wide spectrum of category elasticity and how much that will impact your innovation’s size of the prize, it’s important to understand the driving forces behind such disparity:
The elasticity of the category demand itself: is the demand “must haves” like flour or salt, or can it be completely done without under pricing pressure like for example, scented candles. 4
Substitutability of demand: If the demand itself is inelastic, are there plentiful alternatives that would provide consumers with the means to price shop to meet the same demand, such as switching between fish and poultry for protein intake?
Inflationary relativity: Substitutable categories are bountiful, but are they all experiencing the same price increase just like your category?
Category elasticity is larger when the demand itself is elastic, when there are plenty of substitutions, or when the cost structure of substitutive categories makes them fare better than yours during inflation. Understanding the basic drivers behind category elasticity help marketers make an informed hypothesis on the potential impact from inflation to the spaces they are innovating in.
*Price elasticity measures demand response to price change. If +1% of price change results in -1% of volume change, it’s said that the elasticity is -1. If volume change is -2%, then elasticity is -2. A larger numeric value means that demand is very vulnerable to price increase, and vice versa.
Understanding subtle differences in elasticity for specific segments in a category
To brand managers making decisions for innovations that play in specific category segments, understanding elasticity at the segment level is often more important than category. Segment elasticity are controlled by the same driving forces, but the differences are often nuanced and subtle. Analysis based on historical data and desktop research is often not sufficient and primary research is often used to complement.
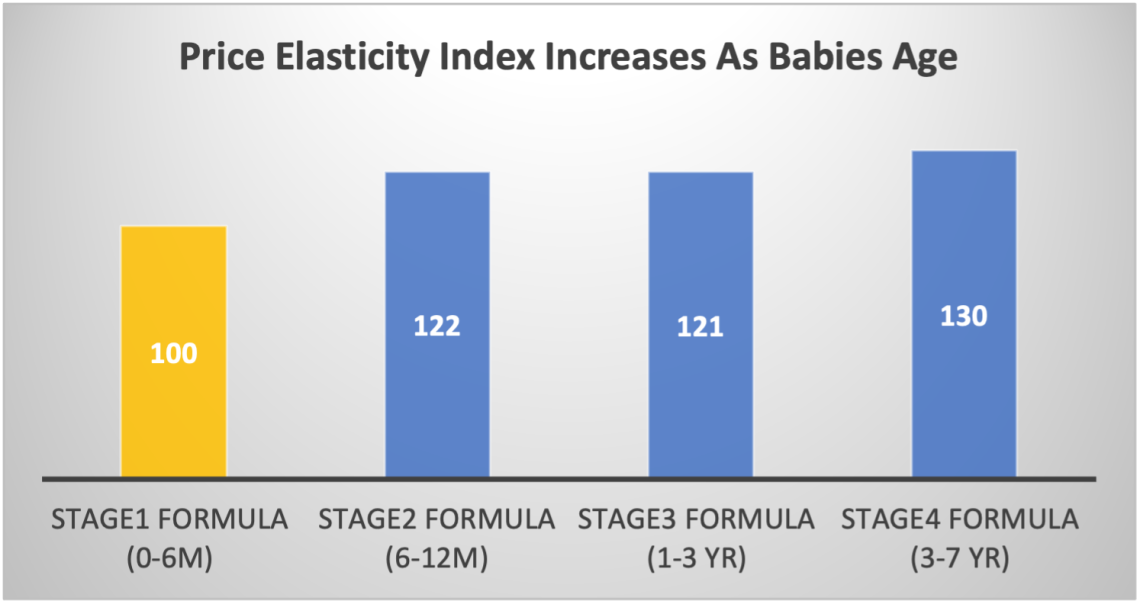
In one such example conducted in late 2021, while understanding dairy products are relatively stable, the maker of a premium infant and kids formula milk range commissioned Ipsos to understand how different formula segments might behave differently to price increases in a South East Asia country. Moms of kids from newborn to 7 years old are observed shopping for formula and milk products. On the choice tasks, moms are exposed to products that have varying prices from a carefully controlled experiment design. The study revealed that stage 1 formula for new-born has the lowest elasticity, meaning that the volume decreases the least when the price rises, this might be intuitive as moms with young babies are most emotionally involved. But as early as 6 months of age, moms are already starting to accept substitutions to formula that a 20% larger price elasticity at that age group was recorded vs. the newborn group. This disparity in elastic expand to 30% for older kids, indicating high vulnerability for formula products to price increase as kids age. The detailed and nuanced findings at segment level confirmed the client’s strategy to focus premium innovation in the newborn segment.
 Price elasticity index increases as babies age
In summary, inflation does not automatically warrant complete remapping of your innovation pipeline, not all categories and segments suffer significant demand loss, understand the elasticity of your space before taking drastic actions.
Understanding the competitive pricing landscape within a category or segment
Once marketers set decisions to innovate or renovate in a certain category/segment, the next step to understanding your pricing landscape is to understand how brands within a given space interact with each other in competitive pricing scenarios. In other words, how do brands in a category/segment change volume in reaction to one another’s price change? These interactive pricing relationships are referred to as Cross-Elasticity. For example, Brand A and B are said to have high cross-elasticity if a price increase in brand A leads to a large volume switch to Brand B, and vice versa.
Understanding your brand’s cross-elasticity with competitors is critical for setting the right positioning for the new product or renovation. Pricing Proximity and Punch-Vulnerability maps are two typical applications of cross-elasticity data in innovation positioning strategy:
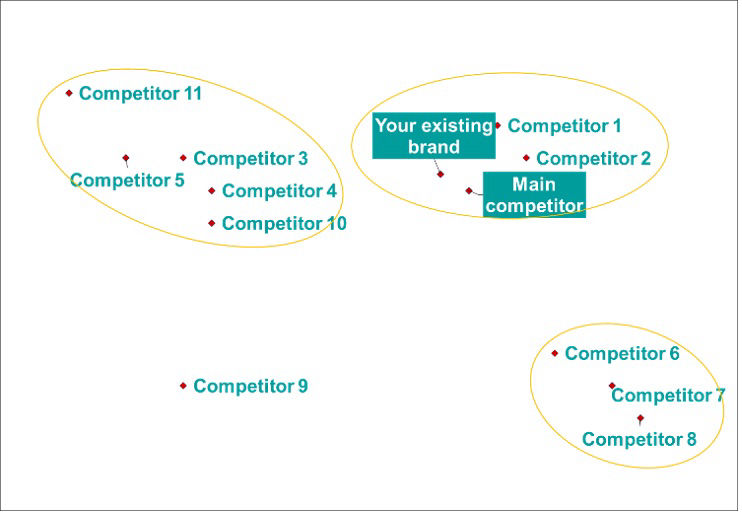
The pricing competitive proximity map reveals clusters of brands with high cross-elasticity within, understanding where those clusters are helping brand managers navigate innovation positioning away from current offering and competitive areas to achieve higher price resilience and portfolio incrementality. In the example map here, new line extensions could aim to position away from the highly pricing competitive cluster where the parent brand and main competitor are in.
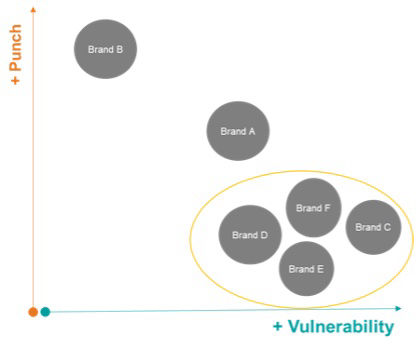
Punch and Vulnerability map reveals competitors you are vulnerable to when you raise prices while they don’t or brands are able to hit hard when you offer pricing advantages. This understanding can be invaluable in choosing the right renovation projects or setting a pricing strategy for line extensions with a specific competitor in mind as targets. In the example map below, your brand could benefit from renovations that are positioned to steer you away from the brand cluster you are highly vulnerable to.


Parting thoughts
Winston Churchill once said: “those who fail to learn from history are doomed to repeat it….”. The world might not be smart enough to avoid another cycle of inflation altogether, but we can at least learn from how successful innovation leaders have navigated inflationary times in the past.
At Ipsos we believe knowledge is the best weapon against uncertainty. 2 years ago, when the pandemic first hit, we helped our clients navigate the rough waters through historical comparisons of crisis cycles of the past5. Today, as new challenges surface we invite you to join us in the new quest to emerge victoriously.
In the last 3 weeks, we have talked about the inflation resilient innovation pipeline, choosing between price increase and downsize, today we discussed how to understand your pricing landscape and the expected impact on your category. We hope you have enjoyed the series.
A special thank you to all the co-authors of “Innovation in Inflationary Times”, which was the foundation for the series of these inflationary articles. Thank you Jin Lu Director, Ipsos US, Luis Fernando Freixedas Abimerhy, Ipsos Marketing, Brazil and Nikolai Reynolds, Global Innovation, Germany.
References
Ipsos, Global Advisor Predictions 2022, December 2021
Ipsos in Turkey, Consumer Behavior Under Crisis, 2003
Ipsos in Argentina, Los Angentinos D.C., April 2003
Suggested reading by Colin Ho and Chris Murphy: A Little Happiness Goes a Long Way, How to Grow a Premium Brand During a Recession, Ipsos 2020
Suggested reading by Colin Ho, Jiongming Mu, Nikolai Reynolds: Ipsos, Innovation in Challenging Times/Product Testing in Challenging Times, Ipsos 2020
Understanding & Reacting to the Current Crisis in Turkey, Ipsos Nov 2021
Jiongming Mu
Global Head of Innovation Testing and Forecasting at IpsosManager of a portfolio of global research products in the Innovation Testing and Forecasting space, including a few fully digital and automated services operated globally. Responsible for maintaining the portfolio while designing and scaling new offers globally at the same time to deliver growth on an 8-digit revenue stream. Manage a global inter-disciplinary team in product development, implementation and execution.


