The Brand Scorecard Framework: Diagnosing Performance, Predicting Potential
Marketing planning often focuses too much on past sales and market share, which doesn't indicate future competitiveness. To gauge a brand’s potential, it's crucial to assess its current marketing performance.

When contemplating the typical approach to marketing planning, you often see a heavy reliance on current sales and market share figures. But that approach feels like living life a step behind. A brand’s current market share only reveals its past performance. It shows the brand's present standing but offers little insight into its preparedness for future competition. To truly understand a brand’s equity and potential, the focus needs to shift forward. This means evaluating its current marketing performance rather than dwelling on past achievements.
Real brand equity, it is believed, lies in a brand’s readiness for what’s coming next. To assess that readiness, it’s also necessary to examine the momentum the brand has as it moves toward the future. That’s the very reason the Brand Scorecard was created. It's a model specifically designed to fill this gap and help marketers plan within the appropriate timeframe. The Scorecard incorporates a set of performance diagnostics that not only reveal a brand’s current performance but also estimate how that performance might translate into future market share.
Each metric within the Brand Scorecard represents a crucial milestone in the consumer journey – from recall, to consideration, to purchase intent, and finally to usage. This model assists marketers in tracking how a brand performs at each of these stages in the consumer’s mind. It also helps identify any strategic issues that might arise along the way. The model captures both the current market share and the current mind share of different brands within a category. This combination of factors provides the clearest picture of a brand’s potential future market share.
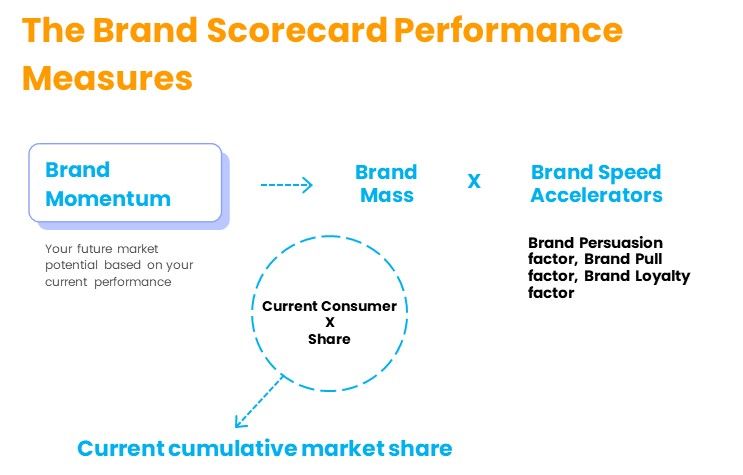
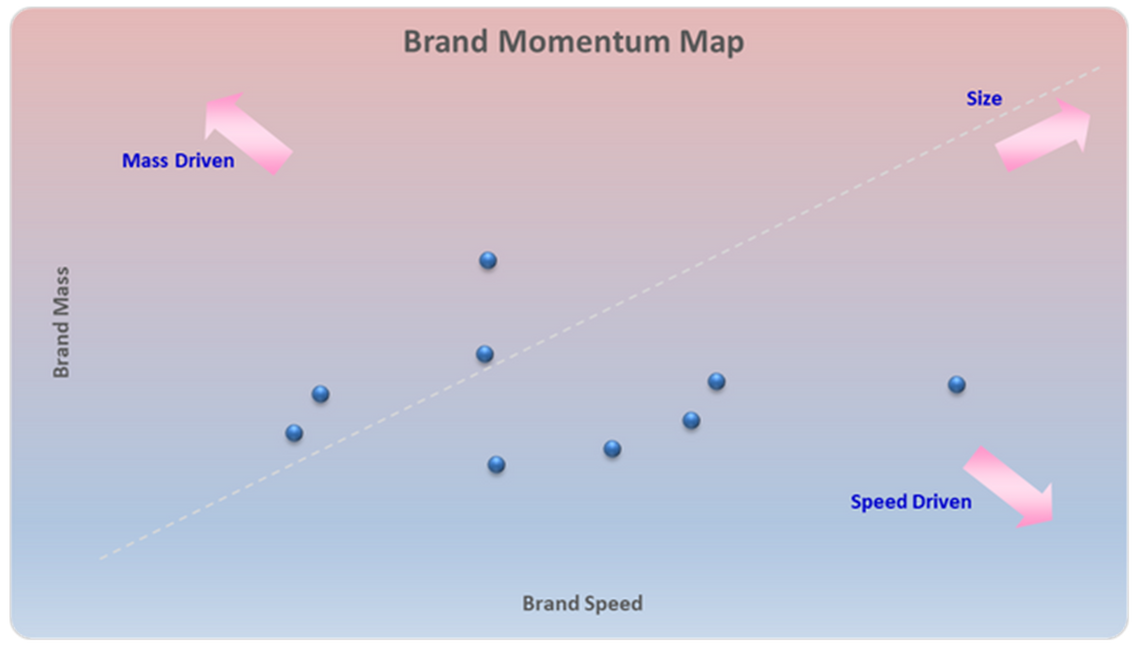
To measure a brand’s future-readiness, a simple yet unique approach is used, inspired by the concept of momentum in physics. In physics, momentum is determined by combining an object’s mass and speed. Similarly, in marketing, brand momentum can be measured by combining a brand’s market share (its mass) with its mind share (its speed). This provides a clear sense of the strength and direction with which a brand is moving toward future market success.
The Brand Scorecard Framework
The Brand Scorecard is an integrated framework developed to measure both a brand’s current performance and its future-readiness. It operates by tracking how the brand performs at different stages of its interaction with consumers. The number of steps in the consumer-brand interaction can vary depending on the depth of breakdown. However, brand tracking typically follows the consumer journey from the initial moment a brand comes to mind, through consideration, preference, purchase, and eventually either continued use or switching to another brand.
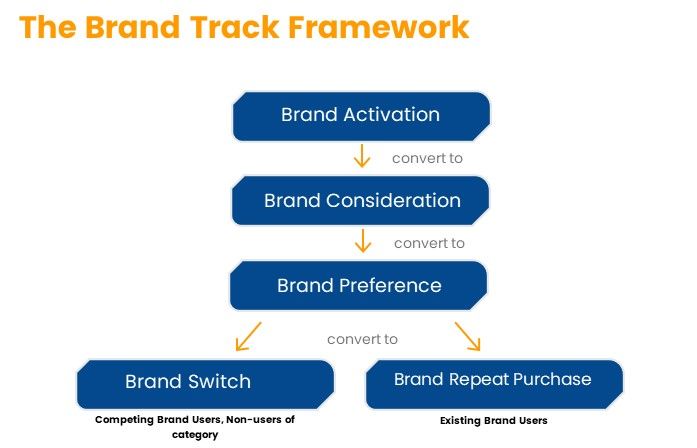
To maintain simplicity yet comprehensiveness, the model focuses on four key milestones in the consumer-brand interaction. These are the most critical points for assessing a brand’s current performance:
Brand Activation: This measures how effectively the brand triggers awareness in the consumer’s mind.
Brand Consideration: This assesses how strongly the brand remains in the consumer’s mind as an option.
Brand Preference: This indicates how often the brand emerges as the top choice when the consumer intends to make a purchase.
Brand Usage: This evaluates the likelihood of current users continuing to buy the brand, and the likelihood of users of other brands or non-users switching to it.
According to the model, these four milestones create three important transition points, where consumers either move closer to or drift away from the brand:
Does the initial brand awareness (the trigger) convert into genuine consideration?
Does consideration convert into a clear preference for this brand over others?
Is that preference strong enough to lead to repeat usage or encourage others to switch to the brand?
A brand’s ability to guide consumers through each of these transitions determines its current performance. The more effectively a brand can convert consumers at each stage in its favor, the more likely it is to succeed in the market.
The Brand Scorecard Measures
The measures used to quantify the brand milestones in this model are rooted in well-established, time-tested marketing metrics. Each one is chosen to align with a specific stage in the consumer’s journey:
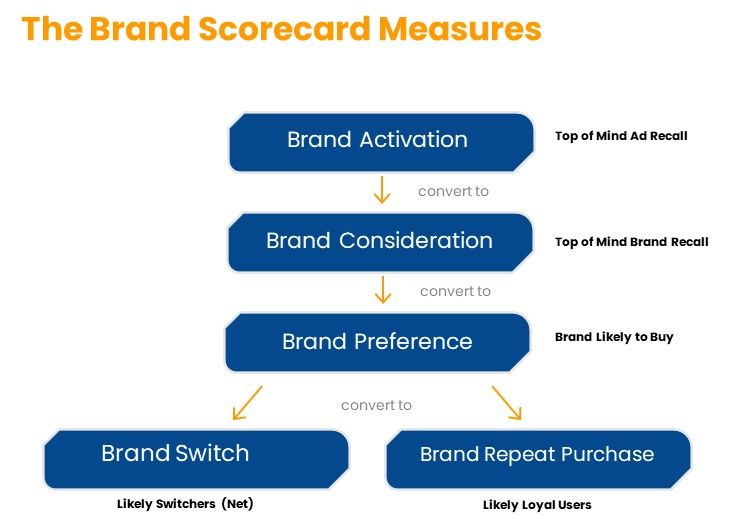
Brand Activation: ‘Top of mind ad recall’ has been chosen as the most appropriate measure for this. This is because advertising is often the largest and most utilized brand trigger among various marketing elements in the modern marketing landscape.
Brand Consideration: ‘Top of mind brand recall’ is used as the most appropriate measure for this. Human memory only considers and processes what it can sufficiently recall and often tends to favor what it can recall with the least mental effort.
Brand Preference: ‘Brand most likely to buy’ is used as the most appropriate measure for this. The intention to purchase a brand clearly reflects a preference for that brand over others.
Brand Usage: The proportion of existing brand users choosing the same brand as the ‘brand most likely to buy’ measures the repeat purchase levels of the brand. Simultaneously, the proportion of existing brand users not choosing the same brand as the ‘brand likely to buy’ serves as a measure of likely lapsers from the brand (switch-outs). These likely switch-outs from one brand also represent likely ‘switch-ins’ for other brands, and vice versa.
To measure a brand’s performance at each of the three critical transition points, a set of simple yet effective proprietary brand performance ‘diagnostic’ measures has been designed. These measures include:
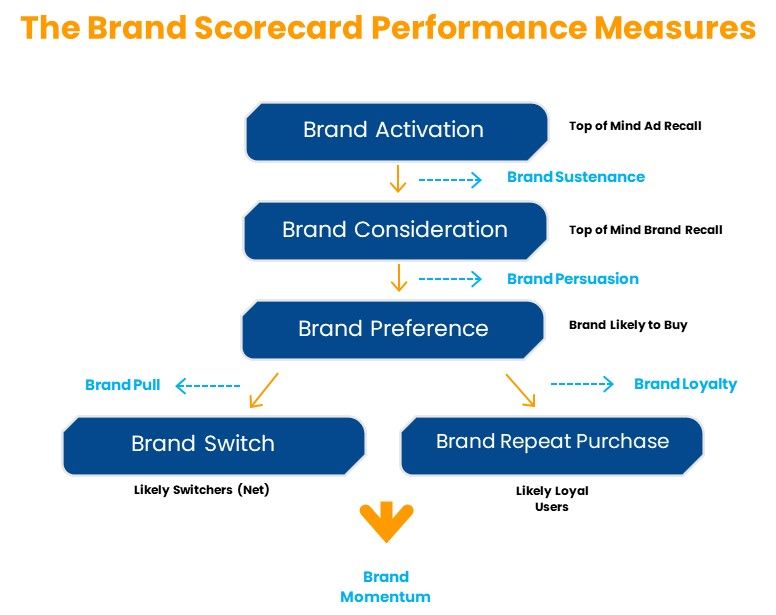
Brand Sustenance: This indicates how much the brand has ‘transcended’ its dependence on advertising to drive its top-of-mind brand recall. It reflects the brand’s power to ‘sustain’ its recall beyond its advertising recall.
Brand Persuasion: This measures how convinced the consumer is about the brand, not just to consider it but also to ‘prefer’ it over other brands in the category (by intending to buy it). It reflects how ‘persuasive’ the brand story is (positioning, proposition, benefits, image, value, etc.).
Brand Pull: This quantifies how much the brand is able to attract and convince consumers of competing brands or non-users of the category to ‘prefer’ or ‘switch over’ to the brand. It reflects the brand’s ‘consumer pull’ power.
Brand Loyalty: This assesses how much the brand is able to convince its existing consumers to ‘continue’ to prefer and buy the brand. It reflects the retention or ‘loyalty’ power of the brand.
These four diagnostic measures clearly determine the current performance of the brand.
Finally, to measure the ‘future-readiness’ and potential of the brand, the concept of ‘brand momentum’ has been developed. A brand’s momentum quantifies the power or energy with which the brand is driving itself to compete for future market shares. The concept of brand momentum is adapted from the concept of ‘momentum’ in Physics, where momentum is the force or energy with which a body is moving at a given point in time. It is measured as a combination of that body’s mass and the velocity at which it is traveling.
Brand Momentum: It is measured as a combination of the current ‘mass’ of consumers the brand has, together with the ‘speed’ at which it is (likely to) gain or lose consumers as a result of its current marketing performance. Symbolically, brand momentum indicates the future ‘market share’ potential of the brand. In simple marketing terms, this means that a brand’s future market share is a result of its current market share (brand mass) and its current mind share (brand speed). That is, the number of consumers a brand is likely to have in the future will depend on how many consumers are using the brand today + how many are likely to switch into the brand - how many are likely to leave the brand.
To measure the current ‘mass’ of the brand, the ‘cumulative’ market share it has accumulated in the marketplace has been taken. This is reflected by its existing consumer base, all consumers who currently own/use the brand (including historical buyers). To measure the ‘speed’ at which a brand is moving in the marketplace, three speed ‘acceleration factors have been identified from the brand’s current performance parameters. These are the brand’s persuasion factor, its pull factor, and its loyalty factor. To calculate a brand’s momentum, a simple average of these three selected ‘speed’ acceleration factors for the brand is taken and then multiplied by its existing ‘mass’ of consumer (user) base.
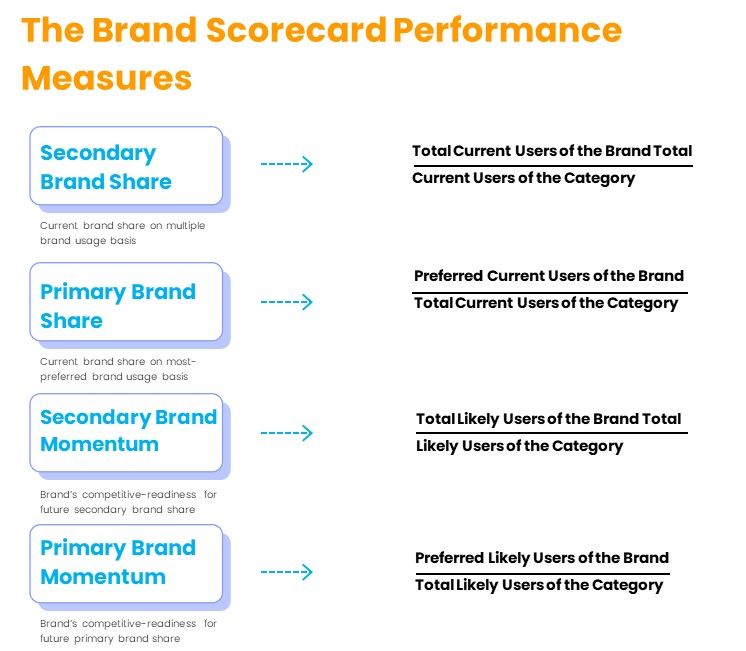
Keeping in mind the possibility of ‘multiple’ current ownership/usage of brands by a single consumer (or a single consuming household), current brand shares (cumulative market shares) are measured and reported at two levels – ‘secondary’ brand shares (at multiple brand ownership or usage level) and ‘primary’ brand shares (usage of a brand on a most-preferred basis among the multiple brands owned/used). Accordingly, the momentum of a brand is also measured and reported in the Brand Scorecard Model at two levels – ‘secondary’ brand momentum score and ‘primary’ brand momentum score.
Interpretation of the Key Brand Scorecard Measures
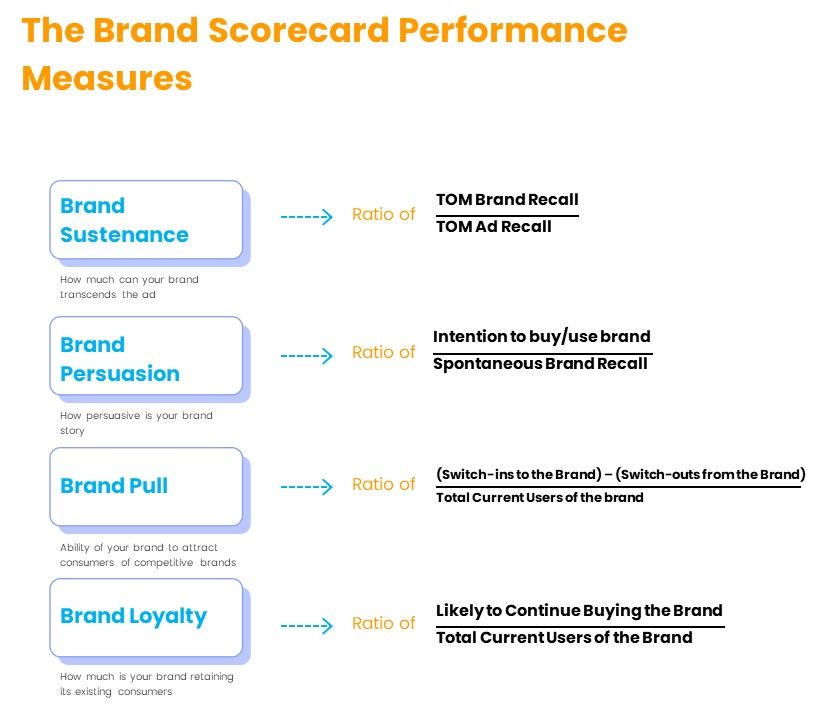
Other than brand momentum, which is calculated as an ‘index’, the other four current brand performance measures are ‘ratios’.
Brand Sustenance Score: A brand with a ratio greater than 1 is performing better than one with a ratio less than 1. This indicates that the former brand is less advertising-dependent and has better sustenance power in the marketplace without advertising support compared to the latter brand.
Brand Persuasion Score: A brand with a ratio greater than 1 is performing above average on the parameter. The higher the ratio, the more consumers ‘prefer’ the brand and not just recall it. This means the brand is performing better in persuading consumers.
Brand Pull Score: A ratio of 0 signifies that as many consumers are switching into the brand as are leaving it. Therefore, this represents an average performance. A positive ratio (more than 0) means more switch-ins than switch-outs, and the brand is likely to be a net gainer of consumers. A negative ratio (less than 0) indicates the brand is slipping, as more consumers are likely to leave it than join it.
Brand Loyalty Score: Here, a ratio of 1 indicates the best performance. It means all existing consumers are likely to continue buying the brand. The lower the ratio from 1, the worse the brand is performing. For example, a brand with a ‘0.3’ brand loyalty ratio has only 30% of its consumers loyal currently and is therefore performing worse than a brand with a brand loyalty ratio of ‘0.5’, which has 50% of its consumers loyalty currently.
Brand Momentum Score: The measure for brand momentum is a calculated ‘index’ and is an absolute value. The higher the index, the greater the momentum of the brand.
For ease of comparing the performances of various brands on these five parameters, in addition to the absolute scores (ratios and index), each measure is also translated into a ‘relative index’ on a scale of 100. To calculate the relative index for each of these scores, the score of the best-performing brand is taken as 100, the maximum value. The relative indices of all other brands are then calculated (calibrated) ‘relative’ to this best score of 100. So, for instance, for a brand that has a relative index of 60, it would mean that it is moving at a speed of 60 kmph when the fastest moving brand in the category is speeding at 100 kmph
Interpretation of the Brand Performance Maps
The brand performance maps are the comparative graphical representations of the performances of all the key brands in the product category. These maps have been presented on ‘logarithmic scaling’ as it helps in representing the data graphically on a more even scaling. This is because the ‘gap’ between actual numbers of the leading brands and those of the other brands sometimes be so large that depicting all of them in the same graph properly is difficult using the ‘normal scaling’.
It is possible that the logarithmic scale graphs show the brand’s relative positions ‘perceptually’ less scattered than they might be when seen on the normal scale. However, the ‘pattern’ of relative positions of the brands in the two scales would always be the same.
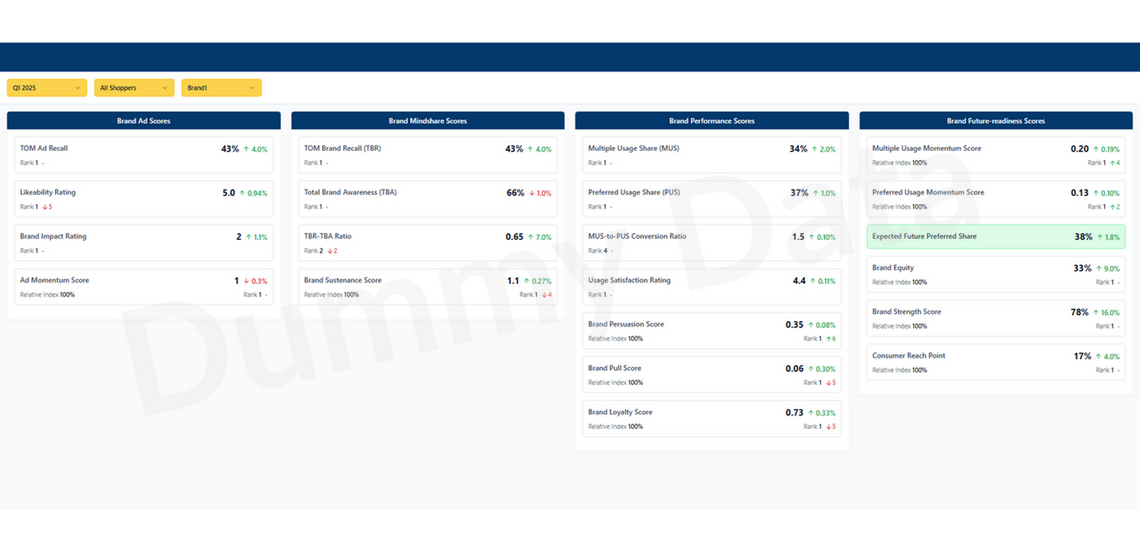
The sample graphics of the brand performance measures are illustrated below.
Sample Graphic
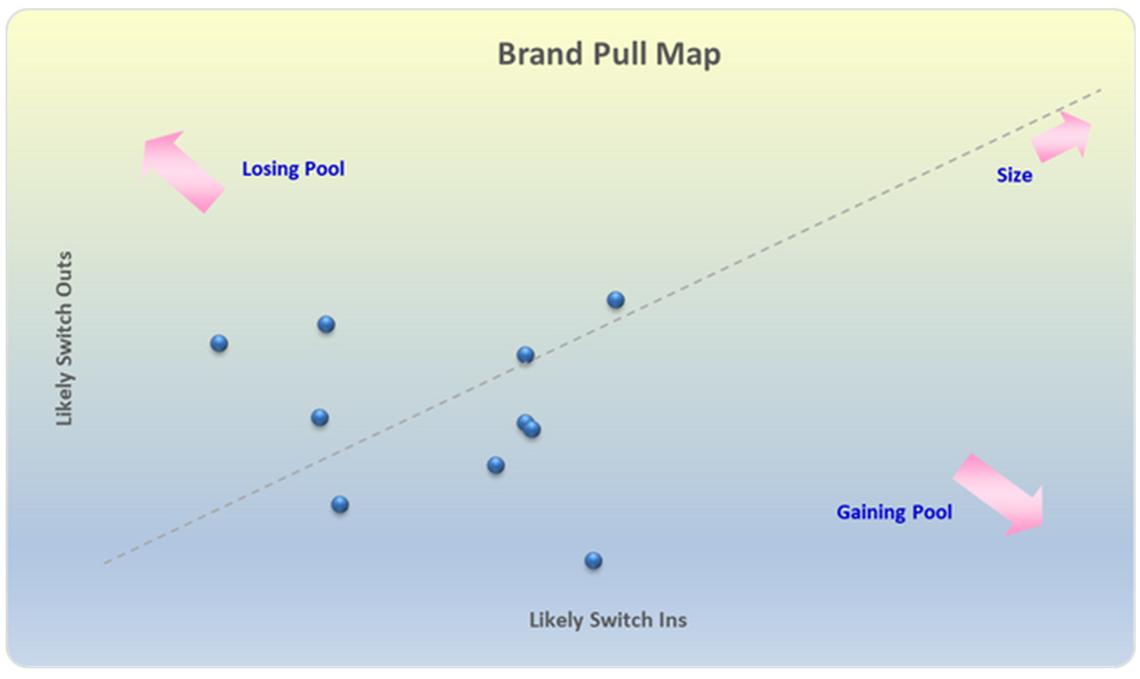
The relative position of the brands in these graphs needs to be understood and interpreted in two different ways.
Firstly, consider the ‘position’ of the brand falling on either side of the diagonal. This position represents a brand’s ‘performance’ on the measured attribute (brand persuasion, brand pull, brand loyalty, or brand momentum).
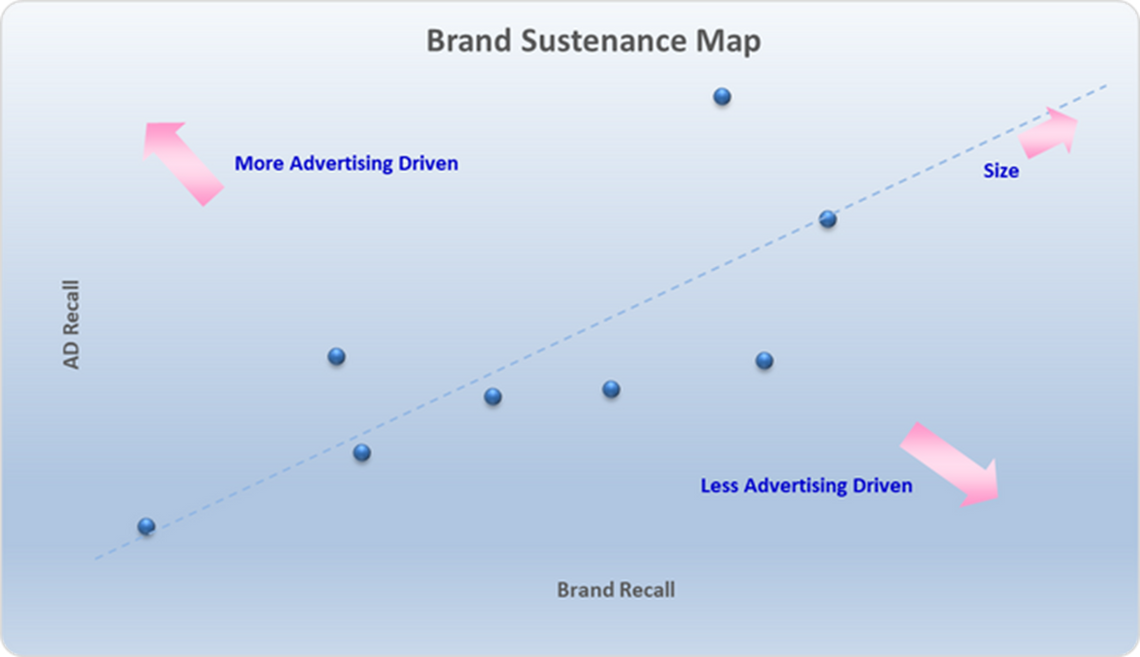
Brand Sustenance Map: If the brand falls to the left of the diagonal, it means its ad recall is higher than its brand recall. It also indicates that its brand recall might be more ‘advertising’ led. On the other hand, if the brand falls to the right of the diagonal, its brand recall is higher than its ad recall. This also means that its brand recall is driven less by advertising and more by other marketing elements like below-the-line activities, shelf space, PR, or even brand heritage. Clearly, the latter brands can ‘sustain’ themselves much more without advertising support than the former brands.
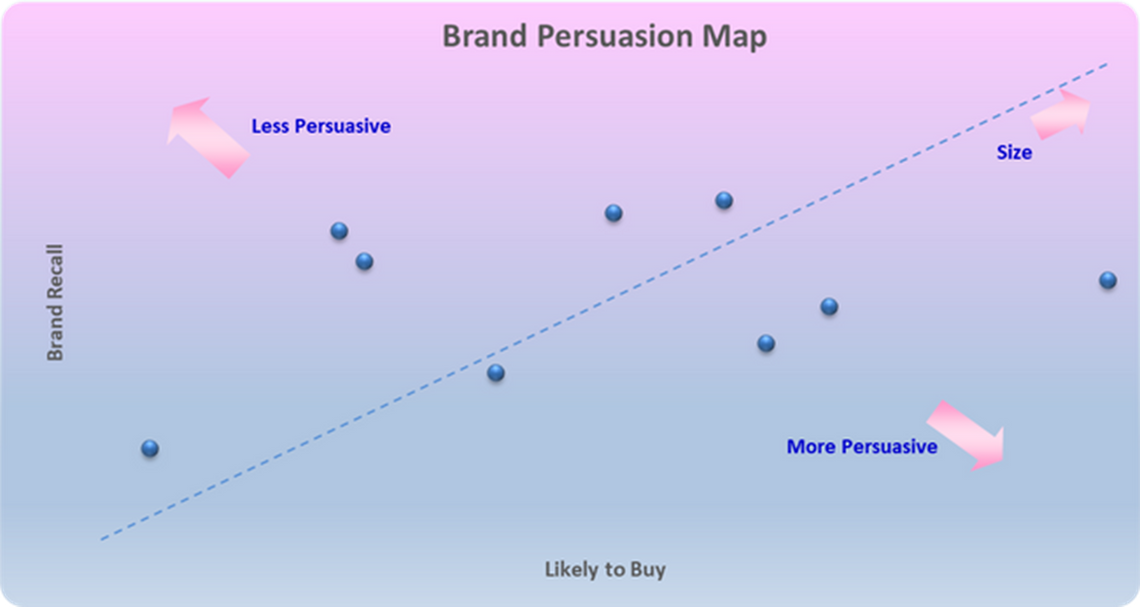
Brand Persuasion Map: If the brand falls to the left of the diagonal, its conversion from brand recall to intention to buy is relatively lower. This implies that the brand has been less effective in persuading the consumer who recalled the brand to also consider buying it (for whatever reasons). Conversely, for a brand that falls to the right of the diagonal, more consumers are thinking of buying the brand than recalling it. This implies that the brand has been relatively more effective in persuading consumers not just to think about it but to think about buying it (for whatever reasons).
Brand Pull Map: Brands falling to the left of the diagonal have more consumers leaving the brand than the number of consumers switching into the brand. This means the brand is a ‘net loser’ of consumers, is losing consumer pull, and is more vulnerable in the marketplace. In contrast, brands falling to the right of the diagonal are gaining more consumers than those leaving the brand. This means the brand is a ‘net gainer’ of consumers, is gaining consumer pull, and is progressing steadily in the marketplace.
Brand Momentum Map: Brands falling to the left of the diagonal are driven more by their ‘mass’ (current cumulative consumer base) than by their speed accelerators (current marketing performance). This means the brand is ‘slowing down’ in the race for the future. In contrast, brands falling to the right of the diagonal are driven more by ‘speed accelerators’ but currently have a correspondingly lower cumulative consumer base. This means the brand is ‘gearing up’ for the race for the future.
The second way to interpret the graph is to look at the brand’s relative positions along the diagonal, starting from the bottom to the top. This reflects the ‘size’ of the brand in the marketplace for the measured attribute (brand persuasion, brand pull, brand loyalty, or brand momentum). The higher a brand is positioned along the diagonal towards the top, the higher its share ‘size’ for that parameter, and the bigger a player it is on that parameter in the marketplace. For example, brand ‘A’ in the brand sustenance map is a bigger player in the market than brand ‘B’ for both brand recall and ad recall, even though brand ‘B’ performs relatively better on the ‘brand sustenance’ factor than brand ‘A’.
Annexure
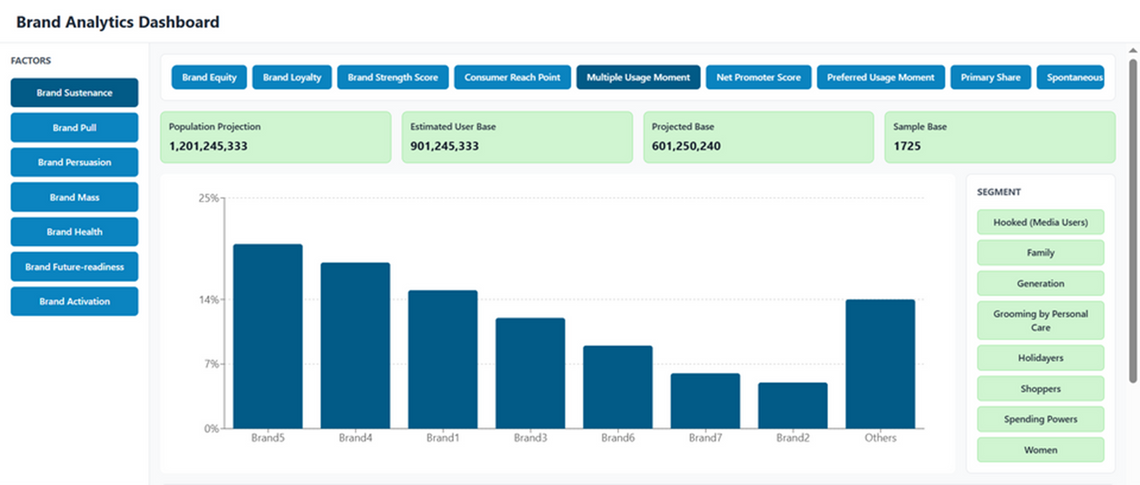
Consumer Reach Point
There is a decision point in every FMCG purchase; a point at which the shopper decides to buy one brand instead of another. The Brand Footprint ranking reveals which brands are winning at that moment of truth, using the Consumer Reach Points measure. This measures a brand’s strength in terms of the number of times brands are chosen by shoppers.
The Consumer Reach Points of each brand is calculated by multiplying three numbers:
• Penetration
• Population
• Consumer Choice
The measurement is then weighted by actual population to calculate the brand’s reach. As well as a clear picture of the size of its global footprint, this reveals where the brand has opportunities to grow its penetration and its frequency.
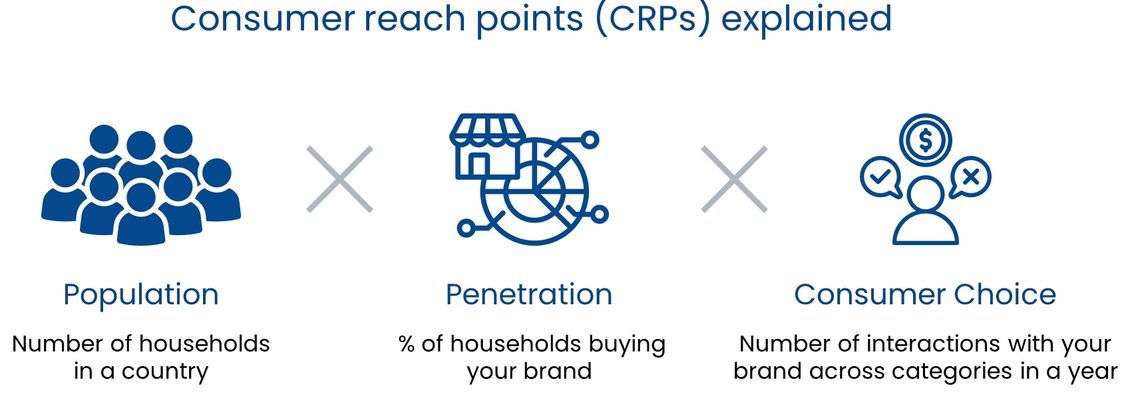
While the number of occasions is the main driver of consumer choice, this alone fails to capture brands chosen for separate needs within a single trip; for example a brand present in both skincare and haircare. This won’t impact most brands but is important for any that cross multiple categories.
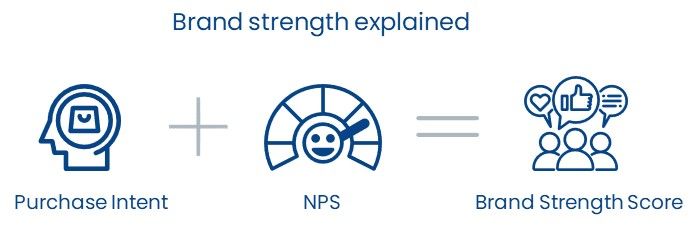
Brand Strength
Brand strength is a measurement of how well your brand communicates your value to your customers. It’s determined by the level of trust, loyalty, and awareness that customers have towards your brand. This can be measured through customer satisfaction surveys, social media engagement, and sales figures.
Brand strength is important because it can influence your bottom line. A strong brand will increase your customer base, which in turn increases sales and profits. But what exactly does a strong brand look like? And how do you go about measuring and building brand strategy and strength? Let’s explore these questions next.
A brand strength, closely related to Brand Equity, is the value that is carried by a brand. It’s essentially a marketing term that denotes the perception of consumers towards the brand or the value invested in it over a period of time.
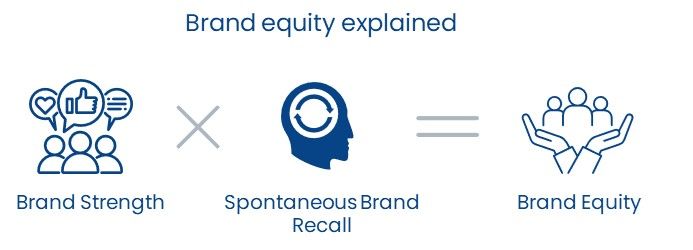
Brand Equity
The relationship between customers and brands generates a type of value-add which can be described as brand equity. For example, some brands are better known than others, others have more compelling propositions, while yet others have stronger associations and emotional bonds with consumers. Brands with high levels of equity generally do better in terms of market share, are less prone to having to compete on price, and generally have more loyal customers.
Annexure
Brand Scorecard Illustrative Questions
Spontaneous brand awareness example question:
Thinking about brands in the [INSERT CATEGORY HERE], which brand first comes to mind? And which other brands come to mind?
In a prompted brand awareness question, a shortlist of brands (including yours) is provided for the respondent to select from. For example:
Looking at the list of brands below, before today, which were you aware of?
This question aims to gauge brand recall and top-of-mind awareness.
What’s the first ad that comes to mind when you think about searching or buying [BRAND X] products online?
This question measures the emotional appeal and personal impact of the ad.
How much did you like this ad?
This question is about identifying the ad’s impact on consumer behavior.
How did this ad impact your perception or decision to visit the advertised website?
Emotional brand loyalty is often assessed using the classic Net Promoter Score question:
On a scale of 0-10, how likely are you to recommend [brand] to your family and friends?
In your own words can you tell us why you gave [brand x] a score of [insert score selected here]?
A brand attributes question will typically include rating scale statements for each attribute to be assessed. For example:
Thinking about [BRAND X] how strongly do you agree with each of these statements? Please use the 5-point scale where 5 means completely and 1 means not at all.
Brand Personality
Thinking about [BRAND X], how well do you associate it with the following characteristics?
Please use the 5-point scale where 5 means completely and 1 means not at all.
Brand Preferences
Tick which brand of [product] you prefer to buy…OR
If you had to choose just one of these brands the next time you are ready to make a purchase, which one would you choose?
Brand Purchase [BRAND X]?
Which of the following brands are you currently using?
Which brand do you use most frequently?
Pradyumna Parida is a dedicated and experienced analytics professional with a strong background in market research, statistical modelling, and data analytics. They excel at transforming complex datasets into actionable insights that support strategic decision-making and are proficient in a range of statistical tools and programs. Pradyumna is passionate about applying innovative research methodologies to drive business growth and deliver impactful results.
With expertise in client operations, report writing, and data visualization, Pradyumna is a skilled storyteller who combines analytical precision with creative presentation. They craft compelling narratives and impactful pitch decks, empowering organizations to make informed and confident decisions.