Confidence, significance, and error: Breaking The 95% rule
It seems as if researchers have come to a consensus on the “right” amount of confidence to have in all studies and for all business questions: 95%.

In business, as in all aspects of life, there is no such thing as certainty; there are only degrees of confidence. Accordingly, different business questions require differing degrees of confidence: security concerns demand near certainty, while growth strategies entail more risk and, therefore, tend to need less confidence.
However, it seems as if researchers have come to a consensus on the “right” amount of confidence to have in all studies and for all business questions: 95%.
At the start of most quantitative research reports, there is a note on the confidence interval (CI) used to determine statistical significance. This is generally set, often unthinkingly, at 95%. 95% CI has become the industry standard, but there is no reason this should be the case. There are times when it is overcautious, and there are certainly times when it is not sufficiently stringent.
So, it is worth contemplating this frequently used but often misunderstood concept: the confidence interval. What does it mean? Why do we use it? And when is 95% CI fit for purpose?
Explaining confidence intervals
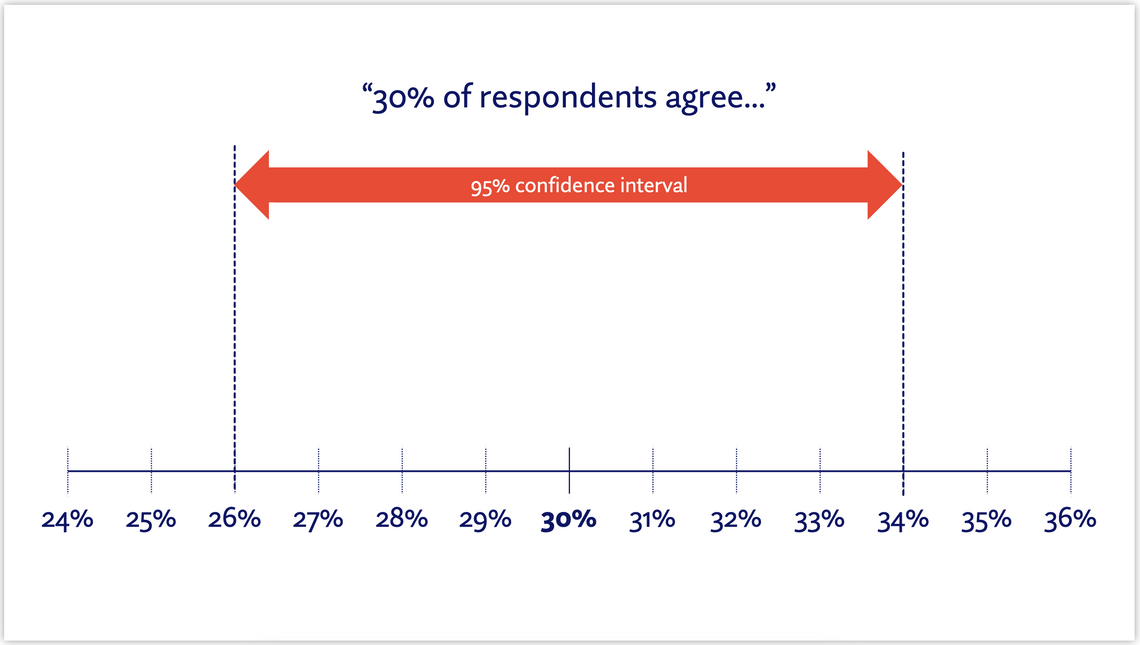
In the context of quantitative research, the confidence interval represents a degree to which you can trust the precision of your results. A 95% confidence interval is a range of figures above and below a sample percentage (30% in the example below). If the study were to be repeated 100 times, the percentage would be expected to fall within this range around 95 times.
If the confidence interval were to be set to 99%, this range would change. The results would be expected to fall within this new range 99 times out of 100, so the range would widen. If the CI were set to 90%, the range would narrow.
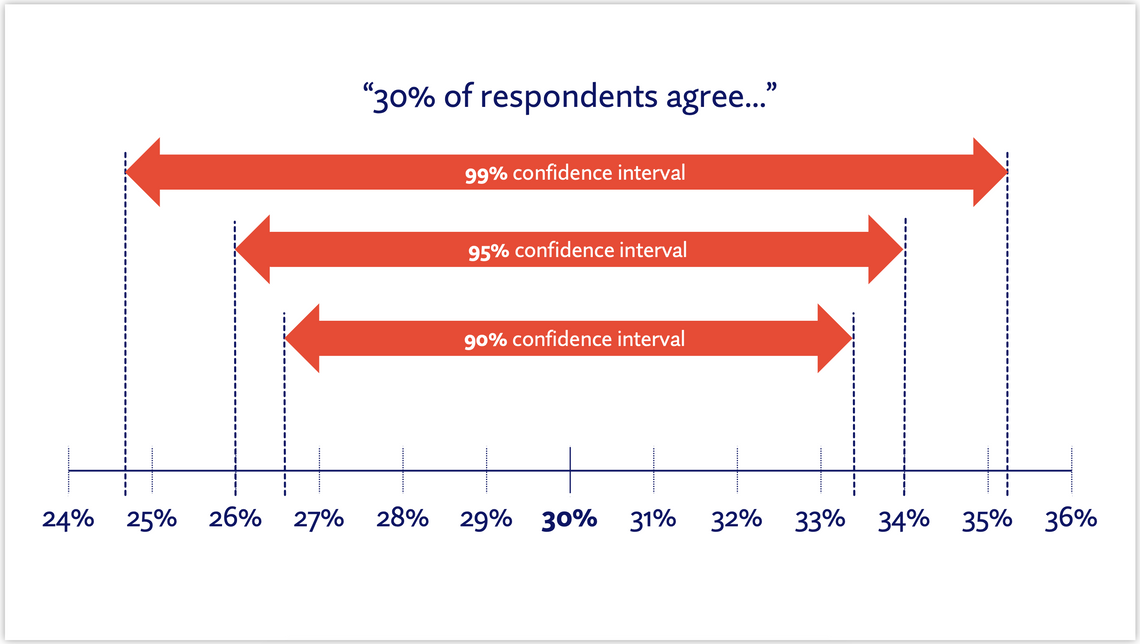
“Statistical significance” is usually used to denote a difference between two figures, so for statistical significance to be achieved between two figures at 95% CI, they would be sufficiently far apart that their 95% confidence intervals would not overlap. The figures could be closer and be statistically significant at 90% (as the confidence interval is narrower) but would need to be further apart to be statistically significant at 99% (as the confidence interval is wider).
Why 95%?
95% CI is completely arbitrary. It was first proposed because of a statistical quirk and has been used ever since. It is now used universally, from academia to commercial research, even when it may not be an appropriate measure of significance. There are situations where a higher CI is necessary and others where a lower CI would be more pragmatic.
To understand this better, consider the three factors which contribute to a “margin of error” for a given statistic:
The confidence interval: this sets the width of the margin of error, with higher confidence intervals resulting in wider margins and lower confidence intervals resulting in narrower margins
The sample size: larger sample sizes give us more confidence and make the margin of error more narrow
The sample proportion: the actual percentage we are using (e.g. “30% of respondents agree…”). The closer to 50%, the wider the margin of error
To understand the relationship between these factors, consider the below chart. It shows the margin of error for a sample proportion of 30% at increasing sample sizes. The three lines denote three CI levels.
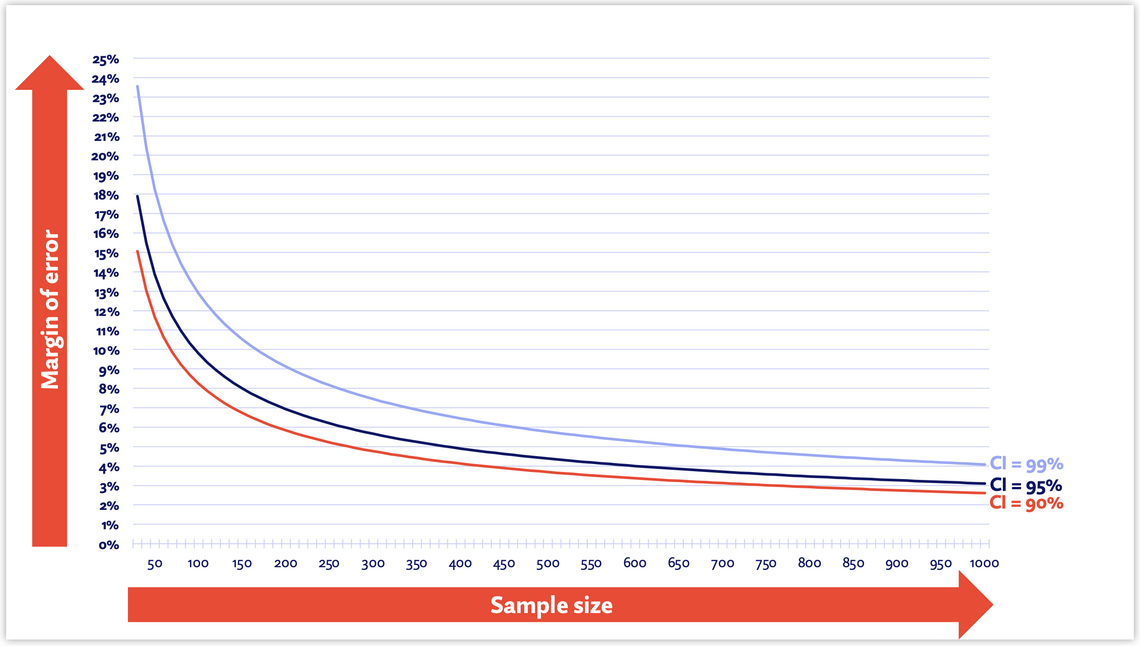
As you can see, at lower sample sizes, the margin for error is very broad, but as you get close to 1,000, the margin of error narrows substantially. With higher sample sizes, the difference in margin of error for a confidence interval of 95% and a confidence interval of 99% is very small, despite the CI of 99% providing 5 times as much confidence as 95% (there is a 1 in 100 likelihood of a difference being due to chance vs 5 in 100).
So, what does this mean for your research projects?
Implications for research
Firstly, it is worth considering when you may need to have greater confidence in your research findings. Are there specific results where you would be uncomfortable with having a 5% chance of producing a “false positive”? In such cases, increase the CI you use. This can be done after completing fieldwork, but if the business requires a high level of confidence, it would be better to account for this at the design stage and commission a larger sample size.
Of course, there are other times when 95% might be too high. This is usually in situations when the sample is relatively small; think B2B projects where a sample is hard to come by or projects with a limited budget. Reducing the CI will produce more statistically significant findings, albeit they may need to be used more cautiously.
More broadly, it would benefit researchers to be more transparent about how we use confidence intervals and margins of error. There are some research results which are so crucial to a business that the margin of error should be explicitly stated (instead of a generic mention of the CI on the 2nd slide of a presentation).
Consider, for example, a volumetric study which predicts 1y volume sales for an unreleased product. A client might be delighted to see the forecast surpass their action standard for product launch, but if the prediction really has a margin for error of ±11% at 90% CI, the figures could and should be assessed (and expressed) more soberly.
As researchers, we can be guilty of using terms that are rooted in advanced statistics without fully understanding their implications. It is our responsibility to get to grips with these concepts, apply them appropriately in research, and present them in a way that users of our research can understand. By engaging with stakeholders about margins of error and statistical significance, we can build a better understanding of how research reflects real-world behaviour and inspire more confidence in insight-led decision-making.
Caspar Swanston
Quantitative Director at LovebrandsCaspar is an experienced researcher with a commitment to rigour, whose unrelenting curiosity is driven by a profound fascination with human behaviour. As head of the quantitative division at Lovebrands, a global consultancy with a holistic offering, he is dedicated to uncovering insight, building strategy, and driving innovation for clients.