How are research methods evolving?
This excerpt is from ESOMAR’s Global Market Research 2024, a key report providing an overview of the global insights industry and market research sector.

Article series
Global Market Research
- Drivers of our $142bn insights industry
- 2023’s Market Research Anchor Europe’s Insights Industry
- The Remarkable Ascent of Asia Pacific in Global Insights
- The Economic Awakening of Latin America
- Navigating trends and challenges in the Africa and Middle East region
- Why the demise of tracking cookies signals a win for market researchers
- How are research methods evolving?
- Global evolution of market research projects
- How have study designs evolved in 2024?
- Inside the $153bn Insights Industry
The following article is an excerpt from ESOMAR’s Global Market Research 2024. This flagship report of ESOMAR, often dubbed as the “Bible of Market Research”, provides you with the most comprehensive overview of the state of the insights industry and the market research sector around the world using data collected by national research associations, leading companies, independent analysts, and ESOMAR representatives.
Technology has become the everyday enabler to collect data more effectively. We no longer think about it; it is just the normal process of market research. In many geographies, it gives us the option to reach the target population faster than ever, on scale, and with the required quality.
Qualitative and quantitative methods
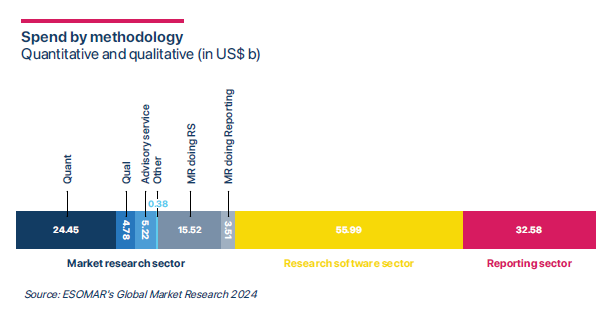
We have known since ever that there are more researchers armed with spreadsheets and statistical models than colleagues looking out for stories in interviews and field notes. Quantitative research globally in 2023, therefore, still takes up 70%, while qualitative methods have 14%. The newly measured proportion of advisory services and secondary data (advisory and secondary, for short) analysis accounted for the additional 15% of turnover, leaving 1% for other.
Looking back at the market research sector only, we’ve adjusted the categorisation in this year’s report to show the broad source of data; previously, the category included qualitative, quantitative, and to some extent, overlapping reporting categories. We, therefore, can’t compare the development in research methods with 2022; the categories in the questionnaire changed. We can, however, make a tentative comparison looking five years back, to the report with data for the pre-COVID-19 era of 2018, which showed quantitative research declining 3 percentage points from 2017 to 78%, qualitative research holding its 14%, and secondary and other research increasing by 3 percentage points to 8%.
We see a more colourful picture when we look at the data by continent and country Europe seems to be the quantitative stronghold with 76%, leaving just 10.5% for qualitative and almost 14% for advisory and secondary. A quick comparison with other regions reveals that the highest proportion of qualitative research, over 29%, is conducted in Africa, while North America shows a higher affinity for the advisory and secondary category reaching up to 22%.
A deeper dive into country-by-country comparison reveals that the top countries by total turnover seem to be in line with the trend of their region, while we see some significant differences in other countries. Since the higher users of qualitative come from Africa, Latin America, and the Middle East, one could assume that what might be at play is also the conditions in a given market — for example, to what extent it is possible to reach out to a sample for quantitative research. Additional factors at play may be the price of qualitative projects in comparison with other methods or perhaps also the desire of clients in some regions to dig deeper to understand consumers and ask more of the “why” questions to develop entry-to-market strategies, while more established markets might opt for more descriptive research, which requires quantitative methods.
Active and passive Methods
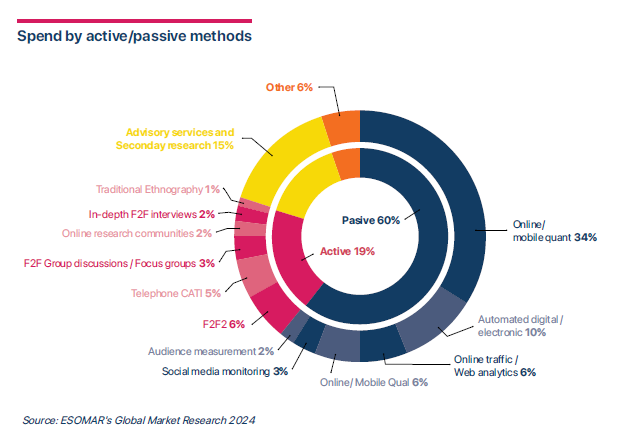
As an industry, we still spend a significant amount of time thinking about using active methods as precious sources. The declining response rate worries us and encourages us to think of ways to gain data and insights into ways that are more convenient for respondents. The whole industry is, therefore, thinking hard about possible ways to make data collection less obtrusive and more mindful of respondents. Where the research objective allows, researchers are aiming to utilise existing data and using technologies to monitor consumer behaviour passively, while maintaining a healthy space for asking questions where necessary.
The passive methods (60%) include online/mobile quantitative research, where respondents can conveniently fill in the questionnaire in their own time, making up 34% of all turnover, with all the other passive methods making up 26% of all research conducted. The core active methods make up 19%, while the newly surveyed category of advisory and secondary research makes up 15%. The passive methods in 2022 made up 62% of the total, so it appears there is a stable situation in this measure.
Established and Tech-Enabled Sectors
In the 2024 questionnaire collecting 2023 data, we rephrased the question to seek a slightly different breakdown. The market research sector is now showing 60% for established methods turnover, 20% for technology-enabled research, and 15% for advisory services and secondary data research, completed by 6% for other.
In the previous years, instead of the new advisory and secondary category, there was reporting; as we see the changed percentile ratio in some countries, we will need to wait until next year to make some conclusions on this data. The regional comparison of 2023 data shows North America has a more diversified portfolio, with 54% in established, 24% in tech-enabled, and 22% in advisory and secondary research. Europe reports just 13% of advisory and secondary research, while technology-enabled is 27% and established is 53%.
Are you interested in knowing the continuing part of this piece? Download the latest edition of Global Market Research now!
Currently a Marketing & Media Coach, Hana Huntová has worked in marketing and communication since 1994. She has held various positions in advertising agencies in the Czech Republic and abroad, including MindShare and Saatchi & Saatchi, followed by working in marketing and communications functions in Unilever.
In 2007, she established an independent coaching and training company, whose clients have included Unilever, Czech Television, Millward Brown, Union of Publishers, Google, and others. A graduate of the Czech University of Agriculture in Prague, Huntova is an active member of the Czech Association of Advertisers. She was one of the judges of the European Effie in Berlin in 2002 and has been the judge of the Czech Effie for the past 6 years.
Article series
Global Market Research
- Drivers of our $142bn insights industry
- 2023’s Market Research Anchor Europe’s Insights Industry
- The Remarkable Ascent of Asia Pacific in Global Insights
- The Economic Awakening of Latin America
- Navigating trends and challenges in the Africa and Middle East region
- Why the demise of tracking cookies signals a win for market researchers
- How are research methods evolving?
- Global evolution of market research projects
- How have study designs evolved in 2024?
- Inside the $153bn Insights Industry