The sunset of Significance Testing
Using Effect Size statistics to inform business decisions

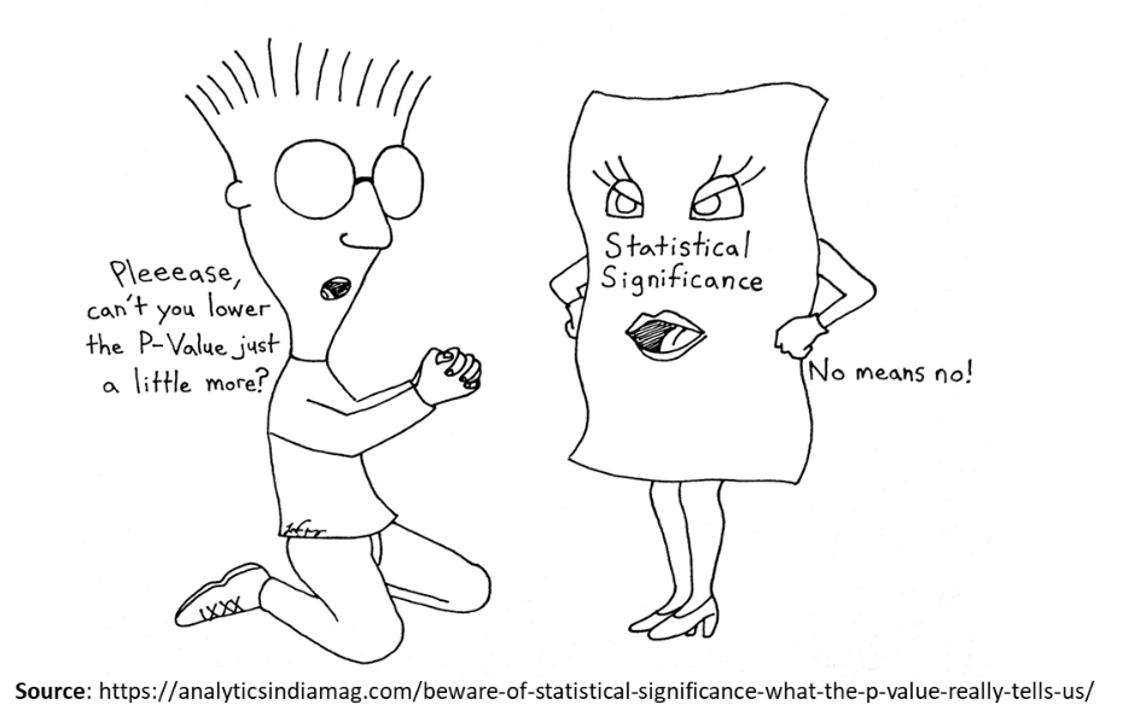
Awash in P-values – and adrift in the data
A key focus of market research is interpretation of differences. Marketing teams who want to know how worried they ought to be or what actions to take routinely ask, “Is that difference significant?” or “What’s the p-value?” And while that basic question is just a matter of straight-forward calculations, the real relevance of the answer is more elusive. These days, no one is short on data. What we’re often missing are the guidelines to assess what truly matters.
The statistical community has finally decided to cut itself loose from null hypothesis testing … The insights community has yet to join them
Prominent statisticians and behavioral scientists have engaged in colorful p-thrashing for many years without being able to dislodge it. But change has come at last. Discomfort with the way p-values are widely misused and misinterpreted has led authoritative organizations like the American Statistical Association and the American Psychological Association to abandon null hypothesis statistical testing (NHST) in favor of a different estimation framework. One academic journal has gone so far as to say it will not publish p-values at all. The overwhelming preference is for estimation frameworks that emphasize the magnitude of difference between any two numbers, not the probability of observing that difference by mere chance.
While consensus about the need to retire p is overwhelming, this tsunami has yet to reach the shores of the Insights Community―a curious island off the coast of academic research, with its own dialect and its own priorities. Research habits die especially hard when they are put to the service of tracking brand metrics over time, where consistency of approach is generally favored over innovation (all claims to the contrary). The fact that proprietary market research data are largely sheltered from public view also means that methods for analyzing them are shielded from public debate.
The eternal quest for significance – and what it actually yields
Null hypothesis significance testing is meant to tell us whether the observed difference between two estimates should be treated as probably real or the product of chance based on sampling error. If the observed difference fails to reach our designated threshold of significance (e.g. 95%), the difference is deemed probably not real. If the difference does reach significance, we can assume it is real - though not necessarily important or meaningful.
In data, as in life generally, it is helpful to distinguish the highly probable from the improbable but real and meaningful are two different notions. “Statistically significant” does not equate to “consequential.” Thus, it doesn’t tell us how much we should care about it or what action to take. Conversely, differences that fail to meet the test of significance (simply because the sample is insufficiently powered) can still be real and potentially quite consequential. Thus, significance testing on its own doesn’t tell us how much we should care about the differences we see or what actions to take. A myopic focus on p-values can divert attention from other critical considerations in interpreting and prioritizing research findings
Here are a few of the reasons why we cannot necessarily tie secure anchor to significance testing.
Statistical significance is heavily influenced by sample size.
By design, p-values give greater weight to larger samples on the presumption that more observations reduce error―and, indeed, very large samples are better able to withstand the effects of outliers. On the other hand, if the sample size is large enough, almost any observed difference will qualify as statistically significant. We have been famously misdirected to change medical practice by tiny but statistically significant correlations found in huge health studies, for instance. On the other hand, if the sample size is small ‒ for instance, because the customer universe is limited ‒ real and meaningful differences may be discounted for lack of formal significance.
Even results deemed statistically significant frequently fail to replicate.
One key reason for wholesale defection from p is a “crisis of replication” that has plagued scientific inquiry for decades. The reasons for this are complex – too long for this article – but they point to a basic problem. We are lured into a sense of false confidence about our data when we look to p for its credibility.
Statistical significance is a binary idea in a world shaded by gray.
While people may be tempted to blur the line when calls are close, significance testing is a binary idea. A p-value is either significant or it is not. You can, of course, grade on a curve by setting the threshold you want to achieve, but because the test is designed to reflect sample size as much as magnitude of difference, there is often a painful arbitrariness to the outcome. A statistical difference deemed significant with n=100 might fail to qualify as significant with just n=99. To state that a number “tends toward” significance is a statistical “wink” that violates the basic premise of the test—though it’s in line with the cloudier nature of reality, which routinely plays out on a continuum.
Significance testing does not allow for comparisons across studies – or even across effects.
A difference that yields a p-value of .0001, is not more important or more meaningful than a difference whose p-value is .05, even when they appear in the same study. Nor can a statistically significant change in Net Promoter Score (NPS) be compared to a statistically significant difference on a 6 or 7-point rating scale in the same survey. Each statistical test must be considered on its own terms.
Looking to ‘Effect Size’ for the real measure of meaning
Standardized effect size calculations allow the observer to consider the magnitude and potential meaningfulness of the difference between two values, unconflated by sample size. The most commonly-used effect size statistic is Cohen’s d, a calculation introduced over three decades ago by Jacob Cohen, a renowned “quantitative psychologist” whose statistical writing is so lively that even a non-statistician will be charmed. Cohen’s d divides the mean difference between two variables by the pooled standard deviation of those two variables. Because it is a standardized measure and thus not directly driven by sample size, Cohen’s d makes it possible to:
Compare means from small sample sizes that are unlikely to yield statistically significant differences
Compare effect sizes within and across studies – and even across dependent variables – in a way that significance outcomes cannot.
Assess how meaningful any observed difference might potentially be, based on its actual size.
Cohen suggested specific thresholds for small, medium, and large effects based on data culled from various scientific disciplines. NAXION has been working to assess whether any adjustments might be needed for market research databases. Meanwhile, we are using Cohen’s suggested thresholds to flag the level of importance or meaningfulness in the difference between two means. For proportions, Cohen offers an “h” test whose premise, again, takes account of variance and is not so dependent on sample size.
Hearing signals above noise
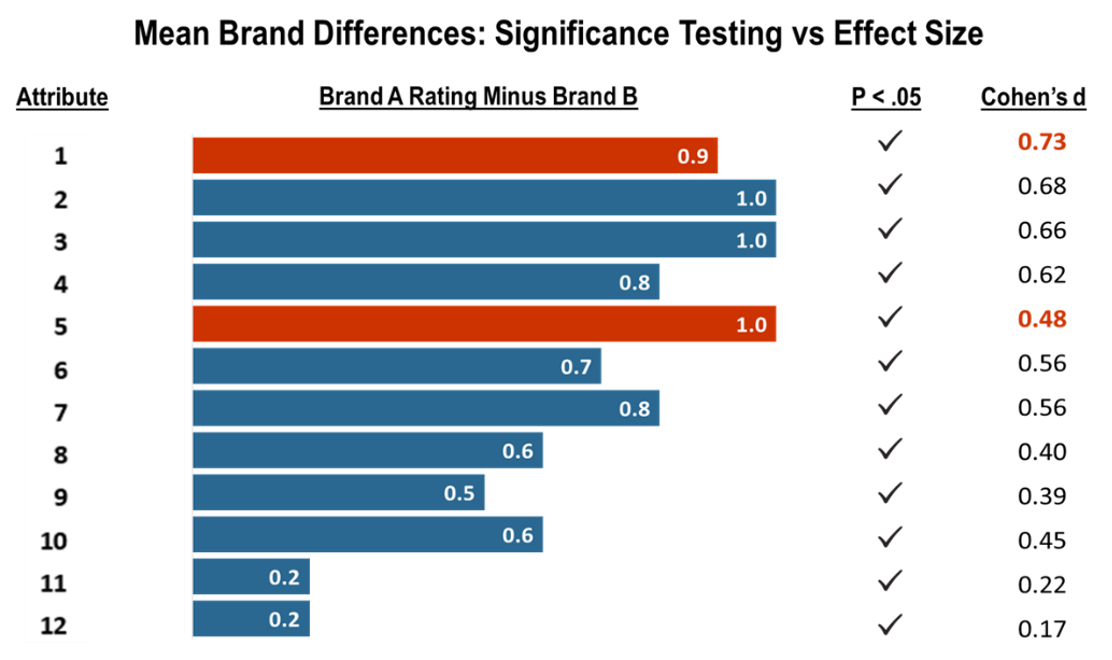
One of our survey databases illustrates how a reliance on p-values as data signals can leave you adrift – or even lead you astray – and shows how standardized effect sizes can provide a sturdier but also more sensitive framework for interpretation. In the example shown, 350 respondents rated two competing products on a series of 12 attributes―the sort of dataset that makes an appearance in so many types of studies, from trackers to market landscape surveys.
Note that while Brand A is performing significantly better on all these dimensions, looking at p-values alone doesn’t allow us to prioritize, and eyeballing mean differences can be misleading. While two of the largest mean differences (Attributes 1 and 5) look comparable, they do differ notably in their effect sizes.
Of course, to complete the picture, we always need to understand attribute importance – as judged by driver modeling or some other measure of customer salience – and we need to know how responsive to marketing efforts any of these attributes might actually be.
Aligning enterprise decision science with other sciences in the quest for meaning
Of course, no statistic – not NHST and not Cohen’s d – is able to deliver “canned,” ready-to-consume meaning right off-the-shelf. Using data for effective decision support requires an interpretive framework customized to the risks and challenges of each enterprise, and a choice of statistical tools that better match our market research objectives. And where very large samples are driving small but significant results, replicability becomes especially important, lest enterprise business decision-makers overreact to a small, one-time blip in an attempt to be highly responsive to the marketplace. The compulsion to p-chase has consequences. It’s time for the decision sciences to join the rest of the scientific community and seriously consider looking at other letters besides iconic p.
Suggested reading
For those with an appetite to read more, here are some authoritative but easily digestible articles:
Amrhein, V., Greenland, S. and McShane, B. (2019). Retire Statistical Significance. Nature, 57, 305-307.
Cohen, J. (1994). The Earth is Round (p < .05). American Psychologist, 49 (12), 997–1003.
Szucs, D., and Ionnidis, J.P.A. (2017). When Null Hypothesis Significance Testing is Unsuitable for Research: A Reassessment. Frontiers in Human Neuroscience, 11: 390.
Cumming, G. (2013). The New Statistics: Why and How. Psychological Science, 25 (1): 7-29.
Susan Schwartz McDonald, Ph.D.
CEO at NAXIONSusan’s career focus has been on the development and protection of robust brands, and the research methodologies needed to support them. She has contributed to the evolution of many standard research techniques, and she writes frequently on industry topics and issues of broader interest. Her commentary on language and culture can be found at www.smartmouth.blog. Susan holds MA and PhD degrees from UPenn’s Annenberg School of Communication.
Michael Polster, Ph.D.
SVP, Life Sciences Practice at NAXIONMichael is a neuropsychologist and methodologist who provides critical decision support to clients commercializing new therapies and healthcare solutions. He provides intellectual leadership on a diverse set of topics ranging from launch strategy and life cycle management to health economics and regulatory compliance. Michael earned a PhD from Cambridge University.