System 3 and storyhearing
Tell us about your life one year from now.

I rubbed my hands in anticipation as another huge dataset splashed into my inbox. "Fire up the old stats engine!" I declaimed, my poor colleagues glancing at each other in anticipation of the usual random data mining exercise.
With 40 columns and 20,000 rows of data, we had plenty of scope to go correlation hunting. With 780 potential inter-column relationships to test, a confidence threshold of 95% would guarantee around 40 significant results even if none of them were real. And once we start looking at subgroups, there could be hundreds. Easily enough to drown any meaningful insights in a mass of speculative relationships driven, almost entirely, by pure noise.
But then I got a call from my friend David Hume. You remember him – Scottish philosopher, icon of rationality, died in 1776. Very interested in a little thing called cause and effect. David rang me up on a Whatsapp voice call (roaming charges to the 18th century are dreadful) and reminded me of his infamous motto: correlation is not causation. You should have trademarked that, Dave. Anyway, I sighed. Held to account, yet again, by the reasoned voice of science.
The data
My colleague Siyanda and I stared mournfully at this vast dataset. Where in a static dump of data can we find causal relationships? Traditionally you'd have to do an experiment: change variable x and see whether y changes consistently. But we already had the data. No chance to go back and re-engineer.
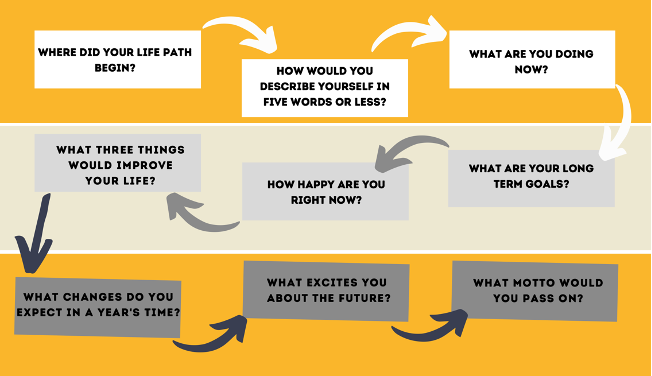
We talked about it. Our usual practice for uncovering insights like this is to ask the respondents: tell us a story. Stories have causality: something happened, and because of that, something else happened. By hearing people's stories, we can understand their causal model of the world. In this dataset, we had indeed asked a "storyhearing" question: Tell us about your life one year from now.
Unfortunately, the stories we got back in this column were very limited. Respondents had already spent a bit of time answering open-ended questions, and perhaps were too fatigued to open up fully about the next year of their lives.
Siyanda had started to explore the idea of qualitatively understanding the people within each of the ten cultures in the study. From their words, we should be able to tell a story about each culture's archetypal person, as represented in the data.
Then we had an idea: could we assemble a story from the different answers to the questions in the dataset? The columns include: Where did your life begin? Describe yourself. What are your long term goals? And the core elements of a classic story structure include a protagonist, a starting point, an inciting incident, a motivation, a series of events and an ending. On another Whatsapp call, me in the back of a car and Siyanda somewhere between Chicago and Botswana, we realised that this dataset, entirely by accident, tells a complete life story for every respondent!

Our task now became clear: find what drives progress through this life story. What are the factors in each chapter of the story, that lead to a specific outcome in the next chapter? If someone is worried in chapter 4, do they take action in chapter 5? If chapter 7 was a downturn, is chapter 8 the recovery?
We analysed these in two ways. First through sentiment – how positive was the language in each chapter? Second through word associations – can we find a relationship between the words used in adjacent chapters?
Unlike a static dataset, a story is time-based. An event happened yesterday before one that happened today. This gives us a new mechanism to find causal factors. We know that today's events cannot be the cause of yesterday's, so if there is a correlation, we know today's event is the effect and not the cause.
Correlation is not causation
Correlation is not causation is an easy thing to shout at a presenter, but it omits part of the scientific story. Indeed, correlation is not the same as causality, but it does indicate causality exists somewhere in the system. Any correlation between variables A and B strongly suggests that one of the following things is true:
A causes B
B causes A
A and B have a common cause
By laying out A and B on a timeline, we can eliminate option 2. We deduce that either A causes B, or an earlier chapter in the story causes both of them.
This causal understanding lies at the heart of System 3, the brain's narrative and imaginative capability. System 3 is driven by a collection of causal beliefs, and the brain's natural ability to prospect and simulate possible futures based on those beliefs.
And so we went hunting – not for correlations but for causes. We searched for words that appeared in one chapter of the story, and what these words predicted about the next chapter. We examined how each word affects the sentiment to be found in the following chapter.
And here is what we found…
There are strong asymmetries in the relationships between words – suggesting that they do indeed indicate causality, not correlation. For example, health appears before travel twice as often as travel before health.
A lot of words recur from one chapter to the next. The strongest predictor of the word job appearing in the future is the word job in the present. Similarly for health, money and travel.
There are also some strong factors pushing toward change, however: health predicts travel, money predicts health and job predicts children!
Words are all very well but for those of us who only trust numbers:
People have a tendency to revert to the mean. A negative word (depressed, violence, poverty) predicts that someone will become happier, simply because it indicates they are unhappy now. Therefore, they are likely to return towards the average happiness level, which represents an improvement.
But when we control for this, a number of words point clearly towards an increase or decrease in sentiment score. The top five are: baby, content, charitable, remodeling and vaccination.
Conversely, sober, Christian and crisis suggest worsening sentiment or a fear of the future.
I've emailed these results to David and am waiting for them to show up in last year's edition of his Collected Works. No sign of them yet, though. It seems we have another causality problem…
Interested in hearing more?
Siyanda Mohutsiwa is a research fellow and data scientist at Irrational Agency, London. A graduate student at the university of Chicago, she is a panAfricanist scholar who studies political science and computational methods. She holds a BSc in Mathematics from the university of Botswana and is a graduate of the Iowa writers workshop. She lives in Chicago with her cat and is working diligently towards a PhD in Sociology.
Leigh Caldwell
Partner & Founder at Irrational AgencyLeigh is a cognitive economist and founder of Irrational Agency, which leads the insights industry in turning the latest science into powerful market research tools. His book The Psychology of Price shows how to apply behavioural economics to pricing strategy, he has presented several times at ESOMAR Congress, as well as at the world's leading scientific conferences in psychology and economics, and he was featured on the inaugural GRIT Future List in 2019.


