In B2B software, where buying cycles run 9 to 12 months and most prospects are locked into multi-year contracts with incumbents, forecasting adoption is one of the hardest jobs in product strategy. We compared the results of a human conjoint with five synthetic conjoint results. One of the synthetic approaches we developed came within a percentage point of real buyers’ choices.
B2B purchases are rarely one person’s call. A typical decision-maker must win over security, finance, the end-users, and an executive sponsor. That multi-stakeholder reality, layered on top of 9-to-12-month buying cycles and multi-year contracts with incumbent vendors, is exactly what makes B2B adoption uniquely hard to forecast, and exactly what AI-simulated buyer research has had the hardest time capturing.
The classical way to answer “who will buy what, at what price” is a conjoint study: a survey that walks real buyers through a series of product trade-offs (this bundle vs. that one vs. neither) and infers which features and prices drive decisions. A B2B conjoint typically runs months and tens of thousands of dollars, requires an expert to design the trade-offs correctly, and depends on a pool of hard-to-reach qualified buyers (security leaders, CFOs, heads of platform engineering) large enough to power the model. Smaller and fast-growing B2B companies, the ones with the most pressing pricing and packaging decisions, are precisely the ones least likely to be able to afford it. That is why so many teams are turning to LLMs as a substitute and why making them work has been the hard part.
So far, researchers have not been able to generate synthetic conjoint results that are decision grade quality. Studies from Harvard, Columbia, Stanford, and elsewhere have documented why: AI overestimates willingness-to-pay by as much as three times on some attributes, gets the wrong sign on others, and silently fills in unstated assumptions. Change the price and the model invisibly changes its assumed quality, biasing preference estimates. These biases persist across LLM generations.
When you ask an off-the-shelf AI to play a B2B software buyer and either pick a product or decline, it almost never declines. In our test, the AI’s adoption rate was 98%, against 53% for real B2B buyers (with adoption varying widely across segments, as we show below). The 47% real opt-out is well above the 33% one would expect from random choice across three options; buyers were actively declining, not picking at random. Researchers Gui and Toubia at Columbia (2024) call this “sycophantic acceptance,” the same failure mode every prior study runs into. By default, AI buyers say yes to almost everything: they have no boss to satisfy, no compliance team to convince, no committee to align.
. We designed a conjoint study with software options. The choices of 160 real B2B buyers were compared with five different synthetic choices. Each choice offered the same three options: pick option A, pick option B, or pick neither (keep the current solution). Options A and B were each described by nine varying features. We compared the synthetic choice results against the human benchmark on two practical metrics: how closely its predicted adoption rate matched the real one, and how strongly its ranking of which features matter most correlated with humans.
We tested four synthetic conjoint approaches
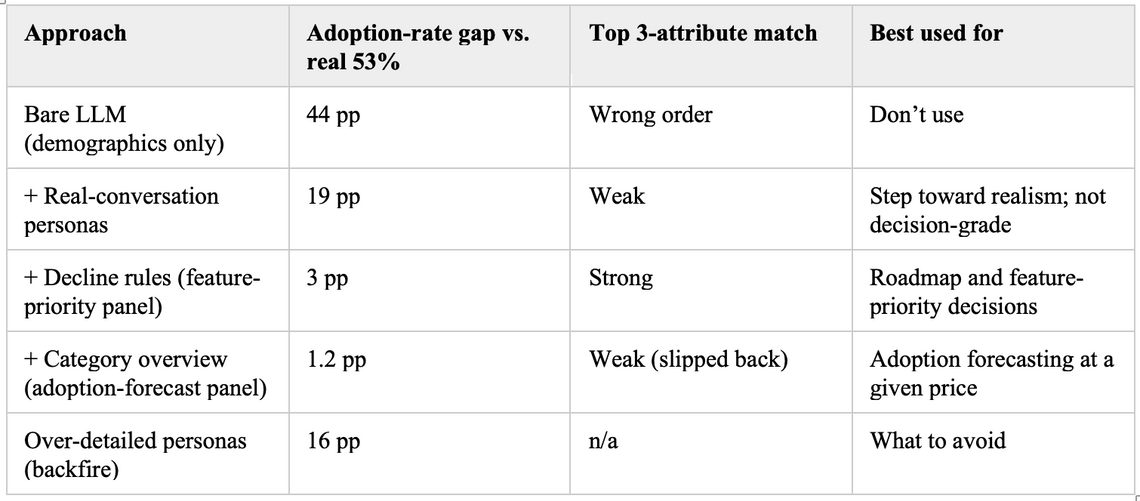
The simplest approach uses a bare LLM with only a demographic-style persona, the standard practice today. It confirmed the failure mode: the AI’s predicted adoption rate was 98%, against the real 53%. Not good enough to inform real product decisions.
A second approach replaced demographic stubs (“Mid-market SaaS buyer, 200 employees”) with personas built from more than 100 actual recorded buyer conversations: a mix of structured customer interviews and sales calls, encoded into a structured profile of each buyer’s situation, jobs, and constraints. This alone cut the adoption-rate gap from 44 percentage points to 19. But it revealed something important. Real-conversation grounding mostly teaches the model that real buyers often say no. It barely improved the AI’s ability to identify which product attributes matter most. Grounding is necessary. It is not enough.
In our third approach we built a panel identical to step two, but now with two additions to every persona: signals about how anchored each buyer was to their current vendor, and explicit decline conditions written in the persona’s own voice, grounded in what their source recording revealed. Each persona now carried its own switching threshold. This “feature-priority panel” reduced the adoption-rate gap to 3 percentage points and moved the AI’s ranking of which product features matter most from a weak match with human judgments to a strong match. It is the strongest setup for figuring out what to build next.
Fourth, we added a brief category overview that each AI persona reads first, exactly the kind of introduction a real survey respondent reads before answering. We call the resulting setup the “adoption-forecast panel.” It pushed the AI’s predicted adoption rate to within 1.2 percentage points of the real 53%, within the noise of any human survey, and improved the AI’s per-buyer predictions. The trade-off: most of step three’s feature-ranking gain slipped back to step two levels. The two set-ups, feature-priority and adoption-forecast, are best at different things.
Lastly, we added more detail per persona isn’t always better. Layering in finer-grained rejection criteria pushed the AI’s predicted adoption rate down to 38%, against the real 53%. The gap widened from 1.2 percentage points back to 16. Piling detail onto a persona without softening its rejection logic makes the panel worse, not better. This effect has also been found in non-conjoint synthetic studies.
The five approaches at a glance