The Empirical Reality of Synthetic Data in Product Testing - Methodological Validation and a Barilla Case Study
Ipsos and Barilla put synthetic product testing to an empirical test. Across 260 validations, it matched human-sample decisions in 92% of cases and helped Barilla reject a risky Ragù recipe change. Read the paper for the method, value, and limits.

“Data is the lifeblood of business, but human experience is the soul of a product.”
Can synthetic data reliably guide high-stakes product formulations? In this paper, Ipsos and Barilla move beyond the hype to prove the empirical reality of AI-augmented product testing. We do not fully replace humans with AI. Instead, by combining the product consumption intelligence of small, robust human samples with the computational power of Deep Learning and product testing data, we demonstrate how synthetic data maintains a 92% business decision consistency rate, preserves statistical integrity, and successfully guided a critical recipe-changing decision for Barilla’s flagship Ragù alla Bolognese.
High stakes, heritage, and the next frontier of HI + AI
For a brand like Barilla, whose culinary legacy spans 150 years, the sensory experience of food is paramount. When consumers open a jar of Barilla Ragù alla Bolognese, they expect a perfectly balanced mix of taste, texture, and aroma. In the food industry, changing a flagship recipe, even slightly due to ingredient availability, or sustainability, carries immense risk. A single misstep in the balance of meat and sauce can alienate a loyal consumer base. Historically, the only way to mitigate this risk was through massive, time-consuming, and expensive human product tests. But as the pace of innovation accelerates, brands like Barilla require more agile solutions. This is where the partnership between Barilla and Ipsos enters the next level.
At Ipsos, we champion the unique blend of Human Intelligence (HI) and Artificial Intelligence (AI) to propel innovation (Guidi et al, 2024, Priestley et al, 2025, Ho et al, 2026). In our previous paper, The Power of Product Testing with Synthetic Data, we introduced "Data Boosting", enhancing small, robust human datasets with synthetic respondents (Reynolds and Ho, 2025). We established a foundational truth: synthetic data will never replace the human sensory experience, but when trained on high-quality human "seed" data, it can replicate human product evaluations at a fraction of the time and cost. Crucially, this replication is not merely a product of advanced algorithms; it is fundamentally anchored in the rigorous applied fieldwork standards that we bring to consumer recruitment and testing environments. Since that publication, we have advanced our models, expanded our Research on Research (R&R), and run 260 validations comparing all-human samples to human-synthetic boosted samples across the globe. In this paper, co-authored with our partners at Barilla, we move beyond the theoretical promise of synthetic data and into hard, empirical reality. Before exploring the specifics of the Barilla home-use test case study, however, it is crucial to establish our methodological foundation. In the following sections, we will detail the rationale behind determining the minimum human sample size (wave 1) and outline the rigorous statistical framework used to validate our AI-augmented datasets (wave 2).
Wave 1: The science of small samples in product testing
Historically, product testing has relied on sample sizes ranging from n=100 to n=300 per product, driven by the assumption that larger samples are always required to mitigate the risk of unreliable consumer responses (variance). However, the level of variance depends heavily on the subject of research. Product testing data is fundamentally different from behavioral or attitudinal data. It features low variability - because the physical product dictates the sensory experience, many people respond to product questions the same way - and “low dimensionality,” meaning it involves fewer variables.
In fact, small sample sizes have a long, proven history in product evaluation. In clinical trials and sensory expert panels, sample sizes of n=10 to n=50 are standard. Furthermore, the very foundation of statistical significance testing in product research, William Sealy Gosset’s "Student's t-distribution," developed in 1908 to assess batch variability at the Guinness brewery relied on sample sizes well below 50. Today, when strict survey research rules are applied (e.g., behavioral science-led, short questionnaires that prevent respondent fatigue, and strict quota sampling), we additionally reduce the margin of error at the source. This high data quality helps to provide structural robustness independent of massive sample sizes.
To empirically prove this, Ipsos ran a massive Research on Research (R&R) study leveraging our global product testing database. We analyzed over 36,000 consumer responses across 185 products in 84 markets (Reynolds et al., 2021). Our goal was to determine if a small human sample (n=50 per product) could accurately mirror the results of a traditional, large human sample (n=150+).
First, using a Monte Carlo simulation with 10,000 iterations, we estimated the "best-worst gap" between products. We discovered a very strong correlation (r = +0.8) between the small and large samples when the performance difference between prototypes was 20% or larger on the scale range. This proves that for product testing, where the goal is to identify highly differentiating products, n=50 is highly effective. To further validate this stability, we performed 1,000 iterations of bootstrap resampling on seed samples. By analyzing the Interquartile Range (IQR) and median distributions across various metrics (9-point Overall Liking, 5-star ratings, and sensory dimensions), we confirmed that a sample size of n=50 consistently yields stable to moderately stable distributions.
To satisfy the highest statistical scrutiny, we developed an analytical formulation to prove why this works. The results revealed a minimum sample size of 45 respondents. This perfectly aligned with our empirical finding that n=50 is statistically sufficient to replicate the performance rankings of best and worst products. Why? Because the core source of variance in product testing is mainly the product itself. You can only increase the sugar or salt level so much before everyone agrees it is too sweet or too salty. When strict survey research rules are applied (e.g., qualified and quota’ed respondents, unbiased interviewing, short questionnaires), data quality provides the structural robustness we require for synthetic boosting in product testing.
Wave 2: Augmenting with synthetic data
While n=50 is mathematically sound for identifying top-performing discriminating products, it presents practical business challenges. Businesses rightfully demand robust, granular data to trust high-stakes decisions. Although n=50 may identify a clearly winning product, it is often insufficient for subgroup and multivariate analyses, while conventional n=200+ studies may be too costly or slow. We therefore use n=50 human respondents as a seed for generating 150 synthetic respondents. Synthetic data bridges this exact gap. To solve this, we use the 50 humans as a "seed" sample per product to train an AI to generate an additional 150 synthetic respondents [1]. But this raises critical questions from the statistical community.
1. Why not just copy and paste the data?
Simply duplicating the 50 human records would constitute pseudoreplication because the added records would not be independent (Hurlbert, 1984; Gelman & Hill, 2007). Treating such records as new observations would underestimate uncertainty, narrow confidence intervals, and inflate false-positive risk [2] (Alaverdyan & Kroening, 2026). Our generative model tries to avoid this trap as much as possible; it does not copy data, nor does it learn in a vacuum. Its development has been informed by Ipsos’s massive historical database of over 36,000 product tests. In statistical terms, this database and human intervention acts as a Bayesian prior, providing the model with "soft thresholds" about how sensory variables naturally perform without “contaminating” the specific products tested by the seed sample. The human seed respondents act as the likelihood to fine-tune the generation. The model utilizes sophisticated AI from Ipsos to synthesize new respondents that maintain the structural properties of the original data while interpolating realistic, independent variability supported by historical category norms with human intervention.
2. Is n=50 too small to train a generative model?
Statisticians rightly point out that training a neural network on 50, 75 or 100 respondents risks overfitting, where the model fails to capture the true variability of the underlying population. However, Product Testing data has less variability. Training a generative model on 50 to 100 respondents raises a legitimate risk of overfitting. We mitigate this risk through two guardrails:
• Strict quota sampling: The human seed is controlled by demographic, geographic, and product-user quotas. A subgroup absent from the seed cannot be generated reliably.
• Dimensionality reduction: We limit the number of closed-ended variables generated relative to the available seed size.
3. Does synthetic data genuinely increase statistical power?
We must be statistically precise here: We do not claim that synthetic data magically generates new, independent degrees of freedom out of thin air. According to Data Processing Inequality [3], an algorithm cannot invent net-new ground truth that does not exist in the input data. Instead, the role of synthetic data is diagnostic stabilization. It projects the structural patterns observed of the human seed sample, informed by relevant historical priors, at a scale that allows clients to run directional diagnostics and multivariate analyses on small sample sizes or sub-groups (e.g., Heavy Users) that would be otherwise impractical.
Synthetic data should not be judged by whether it reproduces every individual human response. Its primary test of utility is whether, when analyzed under the same prespecified decision rules, it leads to the same substantive business conclusion as an adequately powered human benchmark. This shifts the validation target from record-level replication to decision-level consistency.
Ultimately, our focus is on the metric that matters most to our clients: would this data lead to the same business decision? When validating a model that generates synthetic data, simply comparing the synthetic respondents to the original human "seed" sample is methodologically flawed to prove the model works. We therefore compared each AI-augmented sample with an independent, all-human holdout rather than with the seed data used by the model. Across 260 global validations, boosted samples, typically 50 human plus 150 synthetic respondents, produced the same Action Standard decision as all-human samples in 92% of cases, with estimated cost savings of 20% to 60%. This result reflects both model performance and the quality of the underlying recruitment and fieldwork. It is vital to note that a success rate also depends on the quality of the models and a framework for generating quality synthetics (Priestley et al, 2025)[4].
Analysis of the 8% of divergent cases identified three recurring boundary conditions:
• Seed sample skew (quota misalignment): When the human seed deviated from the target quotas, for example by overrepresenting Heavy Brand Users, the model propagated that bias. Strict quota alignment is therefore essential.
• Noise amplification in flat product landscapes: When many prototypes showed no significant differences in the all-human sample, the augmented data sometimes sharpened weak directional patterns into statistically significant differences. Adjusted standard errors can help address this risk (Alaverdyan & Kroening, 2026).
• Excessive dimensionality: Generating too many variables from a small seed, such as 100 variables from n=50, increased overfitting and weakened structural integrity. We therefore specify acceptable ratios between seed size and the number of generated variables.
The strategic value of synthetic augmentation – Or: why not just use a small sample?
This brings us to a critical question often raised by stakeholders: If our Research on Research proves that a small sample of 50 humans already provides a strong 0.8 correlation with a larger sample, why go through the effort of generating synthetic data at all?
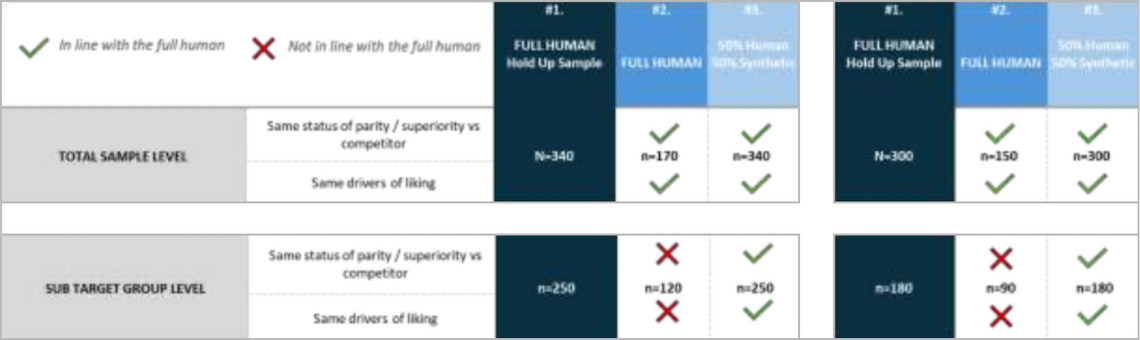
It is true that n=50 alone provides a highly consistent top-line read of the winning product. However, the unique, compounding value of synthetic data lies in diagnostic depth and stability. First, while n=50 is sufficient for a directional read of overall performance, it completely breaks down when we need to look deeper. If a brand needs to understand how "Heavy Users" reacted to a prototype, slicing a sample of 50 leaves us with base sizes (e.g., n=15) that are far too small for meaningful analysis. As illustrated in Figure 1, synthetic data bridges this gap. By boosting the sample, we restore the statistical granularity required to confidently analyze these critical subgroups.
Figure 1: Synthetics can help on subgroup analyses
Source 1: Ipsos
Augmentation cannot recover population features absent from the seed, but it can make the seed’s existing subgroup patterns more analytically accessible. Synthetic data acts as a stabilizing force. In the real world, large human populations contain natural variance. A small sample of 50 might occasionally skew due to a few outliers. Because our generative AI model learns the deep, underlying correlations of the seed data and our model has been developed based on historical category priors, it interpolates realistic variability back into the dataset. This smooths out the rough edges of the small seed, providing a more stable, highly discriminatory read of the data than the small sample could provide on its own. Beyond subgroup analysis, this AI-augmented approach unlocks a host of other strategic advantages:
• support multivariate methods such as preference mapping and segmentation;
• reduce the manufacturing, masking, shipping, and recruitment burden of product tests;
• reduce prototype waste and associated environmental impacts.
It therefore combines greater diagnostic depth with a more agile and resource-efficient research design.
Real-world application: Barilla Ragù alla Bolognese
To truly understand the power of this approach, we provide, together with Barilla, a real-world application.
The background & objectives
In Italy, in 2024, Barilla successfully re-launched their meat sauces. To better suit smaller Italian households, they reduced the package size from 400g to 300g and decreased the price per package to €2.50. This was supported by a digital marketing campaign highlighting the presence of big meat pieces, achieved through a slow cooking method, to underline the product's rich taste. The relaunch was a massive success, leading to improved competitiveness and a 25-30% increase in sales rotations compared to the larger size. Barilla is exploring opportunities to improve its sauce portfolio. Alongside pricing initiatives and jar size changes, the company evaluated potential recipe modifications to its core product, meat sauce. Thus, the need to understand how recipe changes might impact consumer satisfaction and product perception. Barilla aimed to ensure that any recipe adjustments would maintain or improve overall product liking and that the revised formulation would be perceived at least at parity with the current product experience.
The methodology
To measure this risk, Ipsos partnered with Barilla to conduct an in-home Value Improvement Product (VIP) test. Barilla wanted to assess product performance in a real-world environment, at home where consumers use the products in their own ways. We utilized a sequential monadic approach, physically testing the current product against two new prototypes. Instead of a traditional large-scale human panel, we used a boosted sample: 100 Human respondents + 300 Synthetic respondents per cell, allowing us to generate deep insights for specific subgroups.
The outputs & looking forward
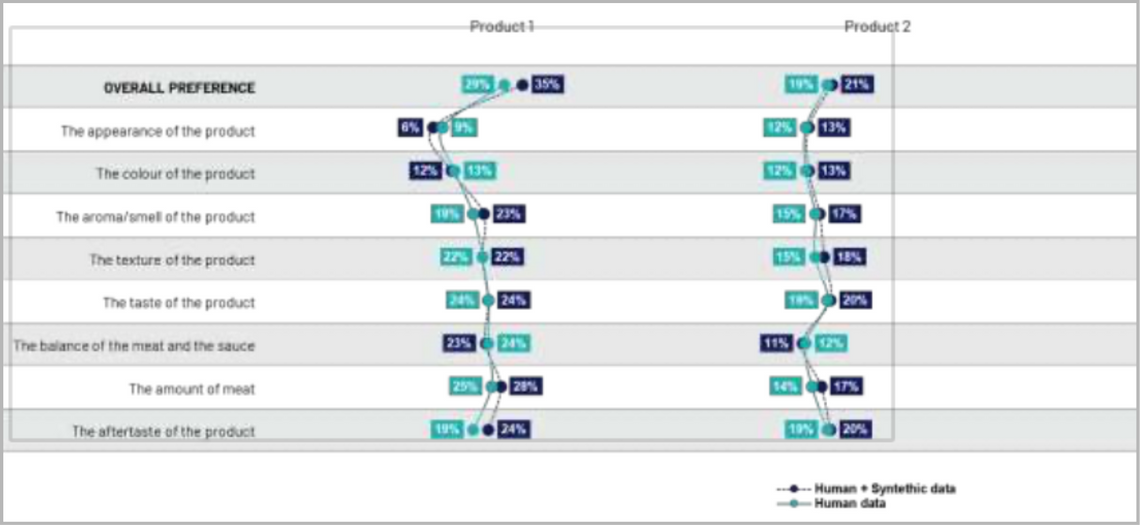
The synthetic-boosted data provided incredibly sharp, nuanced diagnostics that perfectly mirrored what we would expect from a massive all-human trial (Figure 2):
Action Standards Failed: The data clearly showed that no prototype met Barilla's Action Standards for Overall Preference, Overall Opinion, and Alienation. Crucially, there was no difference in the outcome between the human and the AI samples.
Product Diagnostics: The AI-augmented data accurately captured the specific sensory differences of the new recipes.
Subgroup Nuance and Stakeholder Trust: A critical proof point for Barilla’s stakeholders was demonstrating that the AI sample was not merely a copy/paste of the human seed. The synthetic data revealed natural variance, showing that specific subgroups (like Heavy Users) were not perfectly aligned with the main sample's averages. This nuanced divergence proved the soundness of the methodology, building the trust necessary to make a high-stakes decision.
Figure 2: Augmented vs human sample – CONSUMER PREFERENCE
Source 2: Barilla and Ipsos
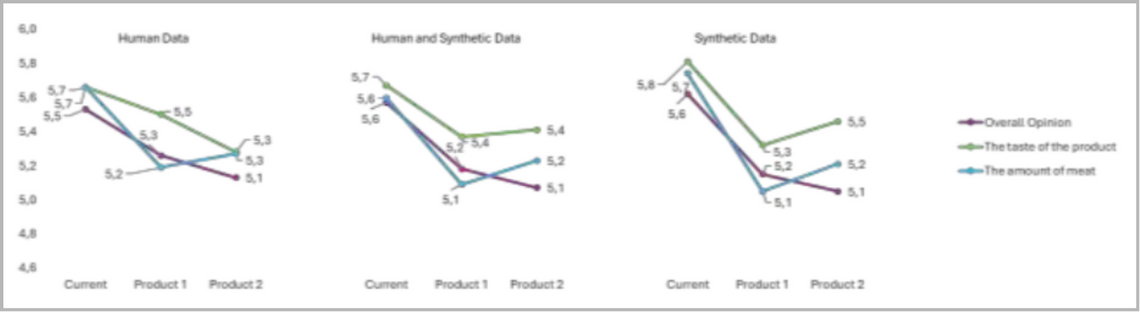
Crucially, the generative AI model does not merely duplicate existing responses. Instead, it synthesizes unique, respondent-level data that introduces plausible respondent-level variation. Figure 3 illustrates this dynamic by comparing purely human data, purely syntheticdata, and the augmented dataset across key product attributes. As the charts reveal, the synthetic data provides a distinct analytical advantage: it enhances the discrimination between the two products, bringing underlying performance patterns into sharper focus without ever contradicting the foundational results of the human seed data.
Figure 3: Synthetic data adding discrimination but not contradicting results
Source 3: Barilla and Ipsos
Because the synthetic data provided such robust, granular insights into the product profile and subgroup preferences, Barilla could confidently and quickly make a business decision: Do not proceed with the recipe change. Both prototypes represented a concrete risk of jeopardizing the current franchise, particularly among the core target of Heavy users.
Guidelines for the future: When to use synthetic data in product testing
Based on our 260 validations and successful client partnerships like the one with Barilla, we have established clear guidelines for integrating synthetic data into product testing:
• Low-risk screening: 50 human + 150 synthetic respondents for rapid elimination of underperforming prototypes.
• Medium-risk benchmarking or other product tests: 75–100 human + 100–125 synthetic respondents when greater category nuance is required.
• High-risk final validation: At least 100 human respondents per product, with synthetic augmentation focused on key or hard-to-reach subgroups and alienation risk. For high-stakes renovations (such as the Barilla case), we recommend utilizing a larger human seed sample, typically 100 or more respondents per product, ensuring an adequate baseline representation of key subgroups. In these scenarios, synthetic data is deployed primarily to boost hard-to-reach segments (like Heavy Users) to confidently ensure no consumer alienation occurs.
Conclusion: The symphony of HI + AI
Data is the lifeblood of business, but human experience is the soul of a product.
As we noted in our paper, an AI can process millions of data points, but it cannot taste the rich, savory balance of meat and tomato in a bowl of Barilla Ragù alla Bolognese. It cannot feel the texture of a product, nor can it experience the emotional comfort of a familiar meal.
What AI can do, however, is learn from a small group of humans who have had that sensory experience, combine it with historical category intelligence, and mathematically project those human truths at scale. By combining the irreplaceable product consumption intelligence of 50 to 100 real consumers with the computational power of Deep Learning, we can achieve the holy grail of market research: faster, highly accurate, and deeply granular insights, all while protecting the bottom line. Synthetic data should not be evaluated on whether it reproduces every human response, but on whether it supports the same business decision as a robust human benchmark.
Synthetic data is no longer just a hype cycle or a theoretical concept. With over 260 successful validations and adoption by leading global brands, it is a proven, strategic tool. The future of product testing is here, and it is a beautiful symphony of Human and Artificial Intelligence.
References
Guidi, M., Hubert, B., Sava, C., & Timpone, R. (2024). Synthetic Data: From Hype to Reality – a guide to responsible adoption. Ipsos POV.
Priestley, D., Ozorowski, M, & Puleston, J. (2025). Synthetic Data Boosting. Unlock the transformative potential of data augmentation
Ho, C., Mu, J. & Duan, Y. (2026). Concept Testing with Digital Twins. Humanizing AI series, part four – How synthetic data accelerates innovation. Ipsos POV
Reynolds, N., & Ho, C. (2025). The power of product testing with synthetic data, Ipsos POV.
Reynolds, N., Zach, J., Cho, J., & Ho, C. (2021). Towards more agile and efficient product testing. Opportunities and limitations for smaller sample sizes. Ipsos POV.
Hurlbert, S. H. (1984). Pseudoreplication and the Design of Ecological Field Experiments. Ecological Monographs, 54(2), 187-211.
Gelman, A., & Hill, J. (2007). Data Analysis Using Regression and Multilevel/Hierarchical Models. Cambridge University Press.
Alaverdyan, M., & Kroening, J. (2026). Calibrating Synthetic Confidence: From statistical facade to statistical fidelity. Ipsos VIEWS.
Notes
[1] We also experimented using 75 and 100 humans as seed samples to generate 125 (100) synthetic respondents but for practicality reasons we focus more on the toughest scenario of n=50 humans.
[2] In statistical testing, a Type I error (false positive) occurs when we incorrectly conclude there is a significant difference between products when none possibly exists. Conversely, a Type II error (false negative) occurs when we fail to detect a genuine difference between products that does exist.
[3] In information theory, the Data Processing Inequality (DPI) is a fundamental principle stating that processing data cannot generate net-new information. In the context of synthetic data, this means an AI algorithm cannot magically "invent" new ground-truth facts about a consumer population that were not already captured in the human seed data or the historical priors. Instead, the AI interpolates and projects the existing signal, making the underlying patterns easier to analyze without artificially inflating the true statistical power.
[4] The SURE framework: Statistical Similarity: Essentially is the data structure and its characteristics faithful to the original? Utility: Is it analytically useful? Rarity & Novelty - does it bring anything new? This checks on whether synthetic data is simply replicating existing data or adding something that is plausibly new. Expert validation: Does it make sense to experts who search for anomalies and check that the data is credible, ethical and feasible. Is it consistent with reality?
Philippe Coquelle
Condiments Associate Director at Barilla GroupBarbara Pederzolli
Insights Director at Barilla GroupDr. Nikolai Reynolds
Global Head of Product Testing, Innovation at IpsosColin Ho
Chief Research Officer at Ipsos, Innovation and Market Strategy and Understanding at IpsosConsumer insight executive with a unique amalgamation of research, data science, psychology, and management consulting skills. Proven successful at extracting and communicating deep consumer insights for clients, and at developing global research innovations by interweaving research analytics, consumer psychology and strategic consulting together