Is the feel-good price present in the room?
Dr Kai-Markus Mueller (Neurensics and Prof. at HFU Business School) started his Keynote session by observing that the value of a product in the customers’ minds is influenced by its presentation. His novel method of using EEG brain scans and other subconscious measures to reveal the value perception of customers and sellers was attention-grabbing. Using an experiment with the audience, he also explained that the elusive feel-good price could be identified by mapping the participants’ response time when they see the product’s price. To my disappointment, this experiment did not involve brain scans. Hopefully, next time we get to see our brains lighting up in real time!
Make pie but not a pie chart!
Michiel Dullaert’s (deperfecteGrafiek.nl) session was a cheat sheet for all data enthusiasts who are on the lookout for novel ways to impart the story their data is trying to convey. He reminded the audience that a well-designed graph has the power to draw attention to the underlying insight. Perhaps this story-telling ability of his brought him the title of “Top rated presentations” of MIE’23. While listening to Christian Hyka from Survalyzer, I remembered the famous saying, “With great power comes great responsibility”. Researchers with the power to influence business decisions should ensure to avoid certain pitfalls like information overload, missing the context of key metrics and ignoring user experience. As a newbie in the world of dashboard development, these two sessions have given me some important checklists to remember.
No respondent was harmed in the research
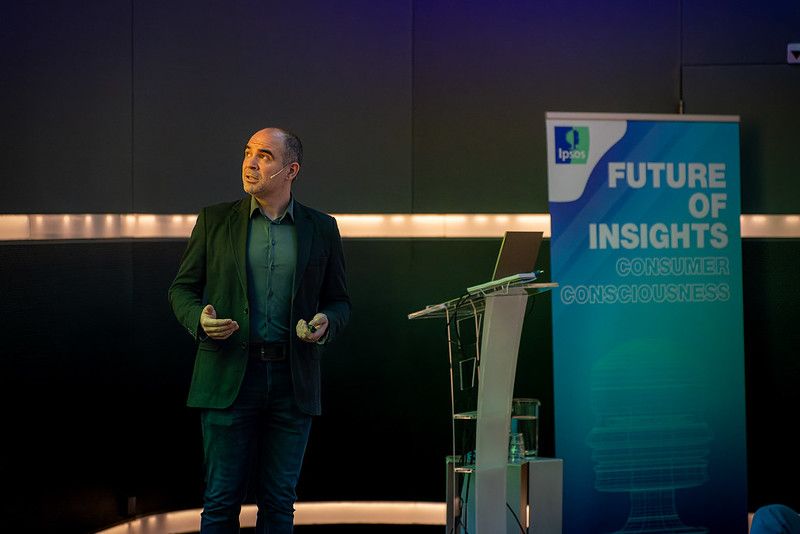
Reineke Reitsma from Ipsos shared her thoughts on the future of Data and Insights in the ever-changing world of research. Researchers will follow their target groups wherever they are, and of course, this includes the world of the metaverse. She explained that in a world where identity is fluid, it is essential for us researchers to think beyond the conventional demographic segmentation of age and gender and think perhaps in terms of behavioural traits. I was more excited to learn about “Synthetic Data” – artificial data that is generated by computer algorithms or simulation. I do understand that the trade-off between the privacy of survey respondents and the accuracy of results is something that should be, for the lack of a better word, researched further.
In the era of difficulty in getting respondents, Yvette Huitema from Norstat and Reto Laemmler from TestingTime explained how and why it is difficult to obtain data from hard-to-reach target groups. I couldn’t help but wonder whether synthetic data could be one way of obtaining data from such hard-to-reach target groups. Only time and more research will tell!
Colour me curious
Through ESOMAR's Belgian Representative and founder of One Inch Whale, Wim Hamaeker’s masterclass, I was introduced to the extent of Science, Behavioural Economics, AI, and consumer research that has gone into the pack design of a milk carton. Next time I go to the supermarket, I will always notice the design and colour choices brands take to stand out among their competitors.
Bad data > no data
The final keynote session from Jon Puleston (Kantar) took us on a journey to some of the notable “Bad Data” examples from history. He also pointed out what market research has learnt from these mistakes and how we can avoid such mistakes in the future. A key takeaway from this session for me was having a narrow vision in research might lead us to lose sight of the bigger picture of the study’s purpose. At the end of the day, I do agree that any data (though bad) is much better than no data at all!
Overall, Day 2’s sessions of MIE’23 were a window into the latest developments in the field of Data and Insights. And I can’t wait to witness and contribute to the industry’s future developments.


