Pandemic rebound through the eyes of research methodologies
This article appeared, in full, in ESOMAR’s Global Market Research 2022 report.

Article series
Esomar Publications
- ESOMAR’s global top-25 insights companies
- Climate crisis
- Verdane: Investment in the Insights industry
- Who has the most developed insights industry?
- …What now? Pricing insights
- Drivers of change in the Insights industry
- The industry in Europe
- 2022 is pronounced “2020-too” for a reason
- Insights in Asia Pacific
- Evolution
- The insights industry in Latin America
- “The Price is Right” in 7 research projects
- Insights into Africa and the Middle East
- What makes for interesting investment
- Insights against chaos
- Is the insights industry too complex?
- What’s the lever for growth nowadays?
- European Union insights revenue reaches pre-pandemic levels
- K-shaped post-pandemic recovery of Asian Pacific insights
- Longer post-pandemic recovery for Latin American insights
- Long road for post-pandemic insights in Africa & Middle East
- A threat to the industry?
- The shifting impact of technology on the industry
- Human involvement in tech-intensive insights
- Possibilities and limitations, of unstructured data
- A future of hyperconnected insights platforms for enterprise-grade support
- The true cost of the “data rush”
- The importance of reinforcing self-brand connection
- The 2022 lattice of research methods
- Pandemic rebound through the eyes of research methodologies
- Growth in strategy and AdTech to outpace competition
- Shaping insights into impact
The recovery of qual over quant
Recovery from the pandemic in some of the largest markets helped revive some of those methodologies most harmed by social distancing policies or the need for remote research. The 2021 edition of ESOMAR’s Global Market Research report observed a fall in the share of qualitative data gathering by up to 3 percentage points. This can be interpreted as a sign of an immature remote qualitative tech-enabled skillset that could not pick up the slack. Conversely, the share of the reporting industry grew by 2 points due to available budgets being diverted from hampered primary research activity to secondary analysis and reports.
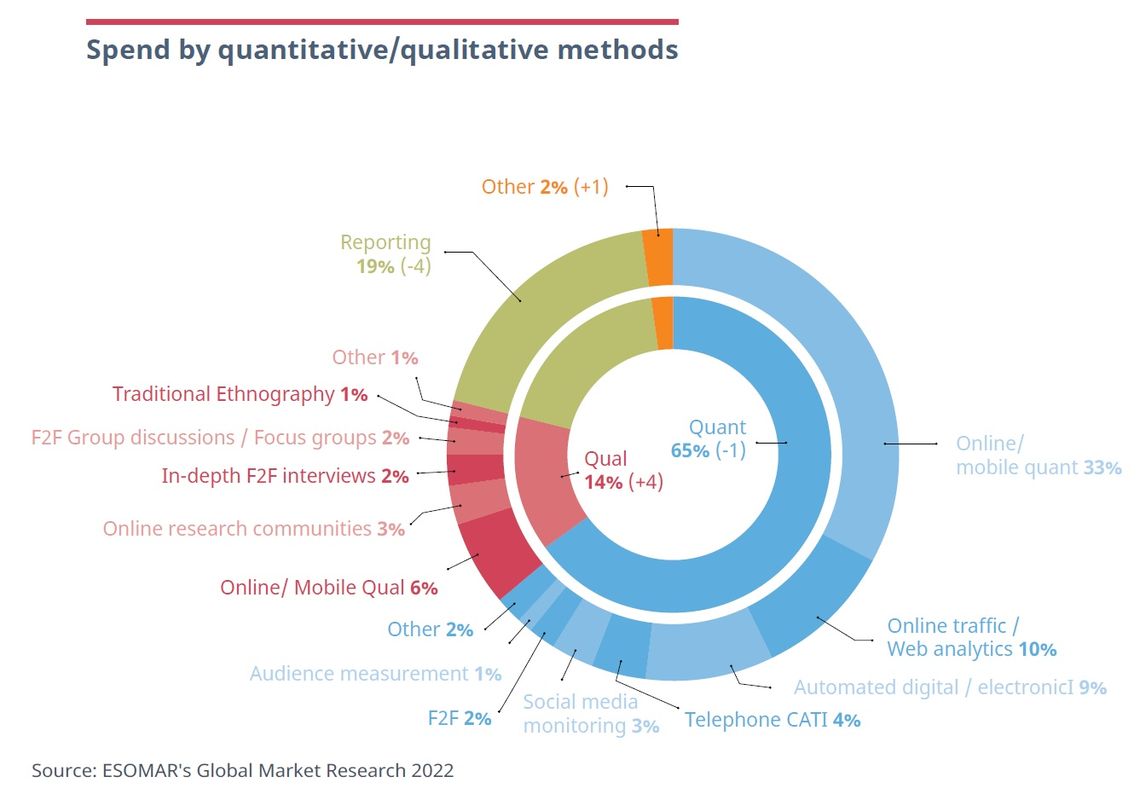
The trend reversed in 2021 as the population learned to cohabit with the virus, companies adapted their processes, and countries relaxed some regulations. It seemed apparent that the tech-enabled methods and remote research (such as online surveys) that surged in 2020 remained popular choices. Quantitative methods lost one percentage point and represented 65% of all industrial activity.
Qualitative methods, however, made a strong comeback, gaining 4 percentage points to represent 14% of turnover. This remarkable rise brings them not only in line with the level observed in 2019 (13%) but surpasses it slightly, showing the need for more nuanced insights and the health of these methods.
While no direct transfer can be assumed between categories, at least part of the gain in qualitative research methods was obtained from the industry’s reporting sector. The representation of this branch diminishes by 4 points, presumably as the need for secondary research “as an alternative to primary” cooled down.
Spend by quantitative/qualitative methods, 2021 (%)
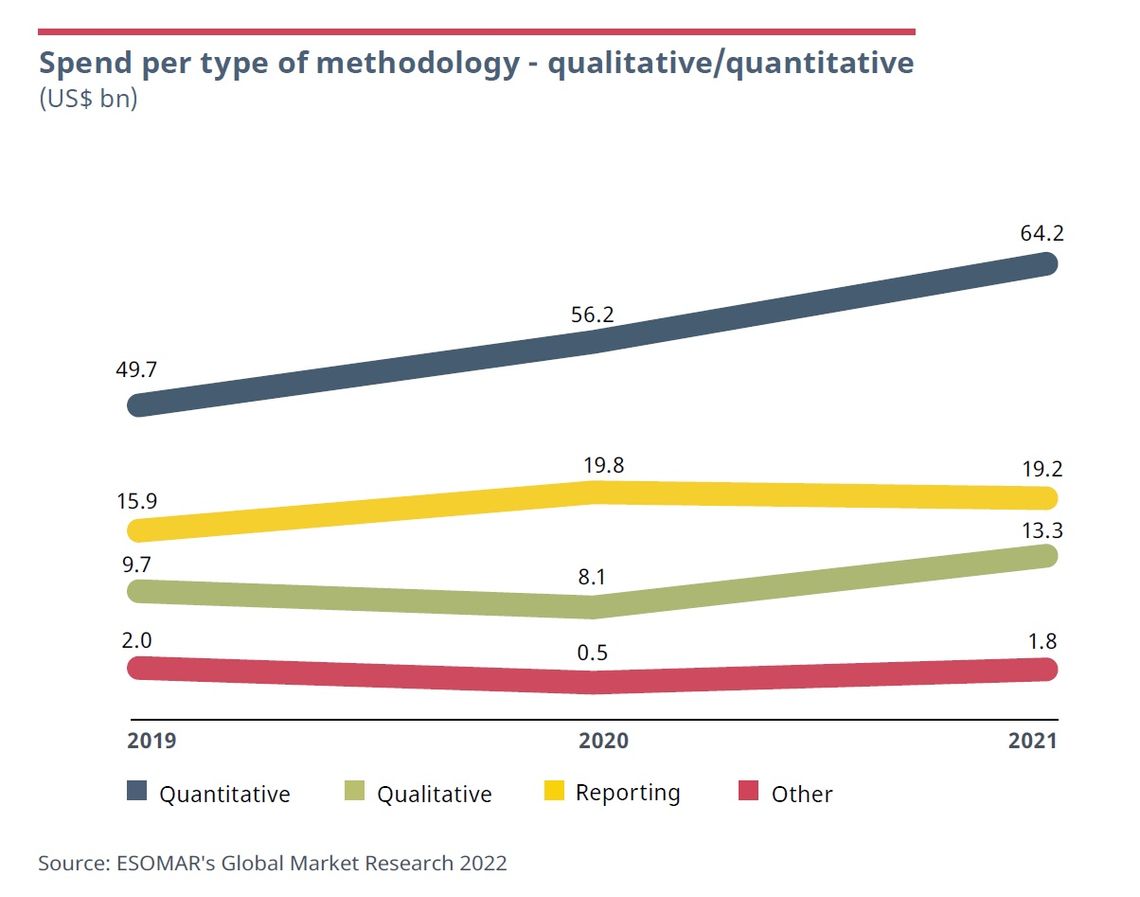
As the industry grew in 2021, so did the usage of several research methods in monetary terms, particularly qualitative research methods. These different methodologies, challenged during the harshest moments of the pandemic, showed the most significant comeback, with over 60% of growth from US$ 8.1 billion in 2020 to US$ 13.3 billion in 2021.
However, research spending on quantitative data collection methods dominated the industry with an expansion of almost US$ 15 billion since 2019. The faster-than-average growth levels of tech-enabled research methods, usually more quantitative, point towards a sustained growth of this typology over time, presumably increasing its share of turnover.
Quantitative research is particularly common in Europe, while qualitative methods remain prevalent in Asia Pacific, Latin America, Africa and the Middle East. A closer look at the shares of passive versus active research methods may shed further light on this area, particularly if these regions present a higher usage of active ones – qualitative methods tend to be active.
Continued technological advancements will likely allow for further expansion of qualitative data gathering in the overall mix. However, it will also facilitate the collection of more data for analysis, further blurring the lines between what the industry has traditionally called quantitative and qualitative. This simple dichotomy has aided research differentiation in the past few decades. But time will show whether it will continue to make sense in the age of the democratisation of data gathering.
Established methods gain ground over tech-enabled ones.
Online qualitative and quantitative methods of collection continued to grow in 2021, representing 38.4% of global spending compared to 36.1% in 2020. As argued in previous editions of this report, online qualitative and quantitative methods belong to the established sector because, even though they require technological equipment in their deployment, the underlying mechanics are historically grounded. Methods like online traffic, however, are effectively enabled by technology; they could not exist without it.
An undeclared portion of the global insights industry (estimated at 17% of the total) largely belongs to primarily technology-driven data analysis companies. Given that this sector primarily tends to use tech-enabled methodologies for data collection, it is reasonable to assume that the portion dedicated to tech-enabled methods remains somewhat misrepresented. It is possible that, had all countries included the tech-enabled sector in their industry measurement, these methodologies would not have fallen by 3 percentage points.
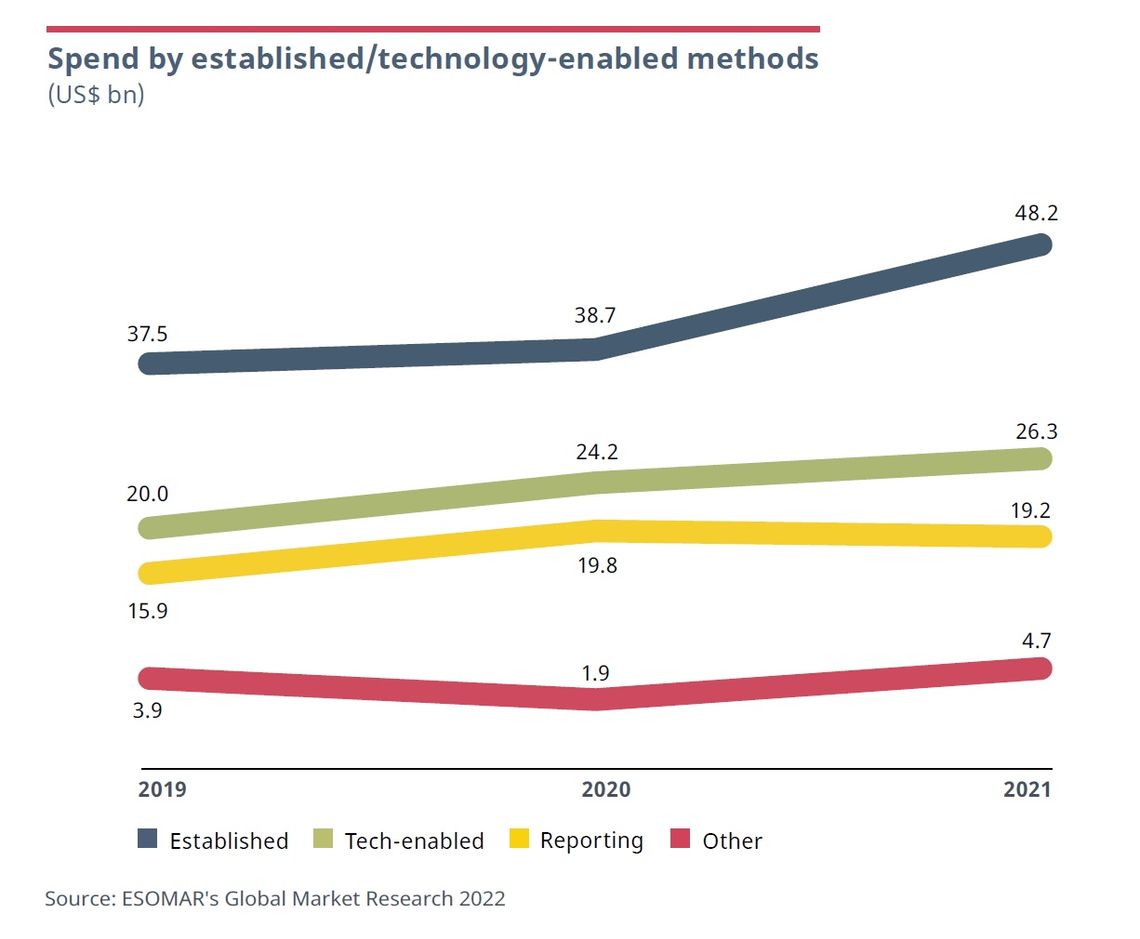
Here becomes evident the variety of methods used by players within the industry. While global research agencies and full-service companies generated an estimated US$ 46 billion in revenue, companies from either sector, including tech and analytics, generated up to US$ 48 billion utilising established methods. Here lies further proof of the dislodgement of methodologies and industrial sectors explained earlier. Likewise, tech-enabled research methods continued to grow and expanded by more than US$ 2 billion to US$ 26.3 billion.
Africa, the Middle East and Asia Pacific are the areas where countries have identified the largest share of established methods – though countries like China or Japan only survey the established industrial sector. Conversely, North America and Europe represent the regions with heavier usage of tech-enabled methods, even though countries like France, Germany, Italy or Spain do not survey the tech-enabled sector.
Consolidation of passive methods over active ones
The last step in the lattice of research is the comparison between active and passive methods of data collection. An interesting observation is the levelling of passive data collection at 63%. This typology gained 10 percentage points in 2020 due to social distancing measures and other limitations imposed by the pandemic. Rather than returning to a level closer to its pre-pandemic share, passive methods maintained this level over 2021. Passive data gathering, particularly online quantitative and qualitative research, with a combined 38%, dominated the industry.
Like qualitative methods, the predominance of passive quantitative tech-enabled collection methods may suggest a further decline in active research. However, just as technology can tackle qualitative data collection, so will it allow for more sophisticated forms of active data gathering. But until these new developments dent the relative shares of these typologies, active methods will likely remain in the minority.
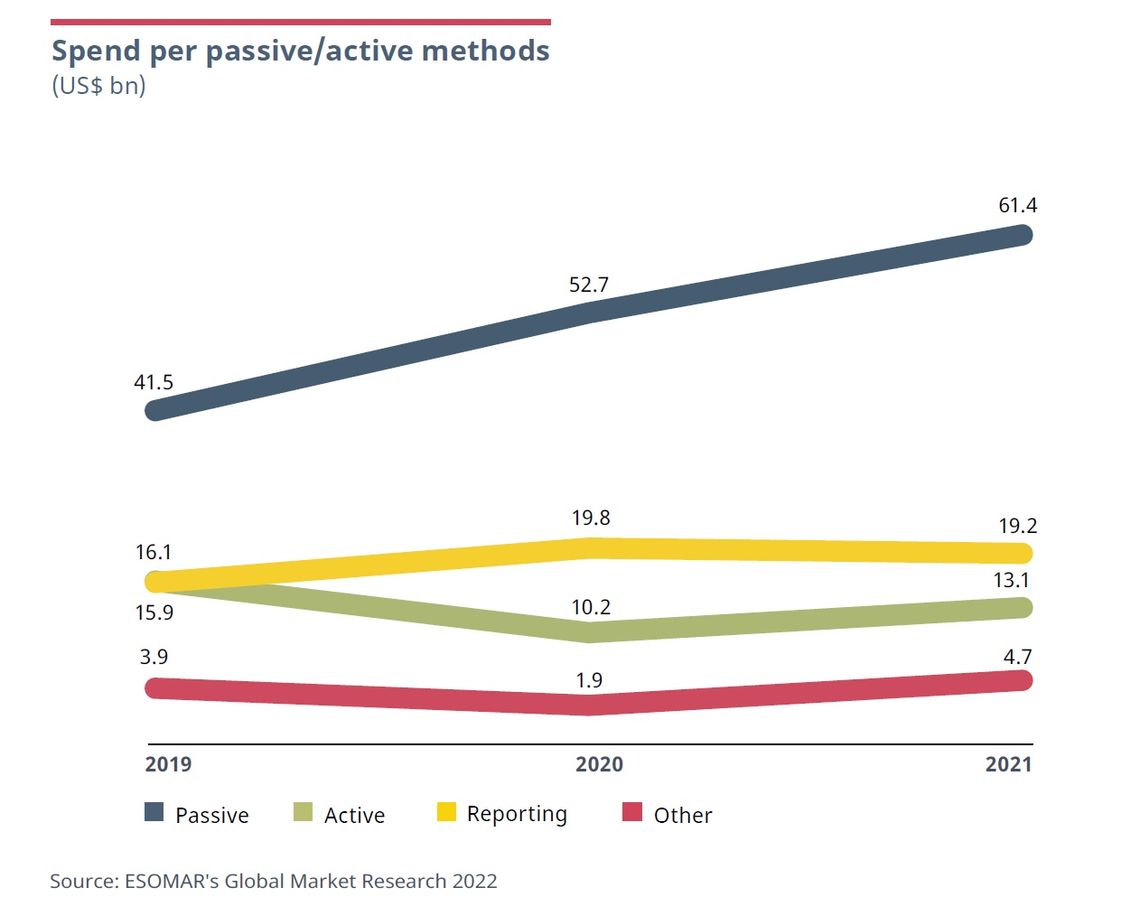
Passive methods grew in 2021 by almost US$ 9 billion and now represent US$ 61.4 billion globally. Translated to 16.7%, this growth is lower than active methods, which increased almost 28% to more than US$ 13 billion. But it is worth noting the 48% growth in passive methods since 2019, compared to the negative one of -18% declared by active ones. Again, while active methods may increase their share in the future, the data suggest a rather prolonged period of dormancy for now.
Nonetheless, active research allowed for gathering far more nuanced data. While frequently comparatively expensive to implement, a complete research project will sometimes benefit from the detail captured by active data-gathering methods. At other times, it becomes easier and more accurate to field questions to the individual directly rather than to indirectly scramble behavioural data through unstructured data. The partial recovery of this trend shows the recognised relevance of this typology within the industry. However, further growth in the share of active data collection may soon be possible through a technological push.
Xabier Palacio
Head of Intelligence, Advocacy and Standards at EsomarXabier guides the creation of influential studies, reports, and guidelines at ESOMAR while overseeing the Departments of Professional Standards, Intelligence, and Public Affairs. He leads efforts to provide industry insights, maintain ethical standards, and advocate for the sector’s interests. ESOMAR, a global hub for research, insights, and analytics since 1947, supports over 50,000 professionals and companies worldwide. Under Xabier’s leadership, these departments ensure the industry’s continued growth, fostering collaboration and advocating for responsible practices with regulators and legislators.
Originally from Spain, Xabier has been living in the Netherlands for a number of years, where he studied a Master in International Economics followed by a Master in Marketing at the Erasmus University of Rotterdam. He is fluent in Spanish and English, has a decent command of Dutch, and loves music about as much as analysis.
Article series
Esomar Publications
- ESOMAR’s global top-25 insights companies
- Climate crisis
- Verdane: Investment in the Insights industry
- Who has the most developed insights industry?
- …What now? Pricing insights
- Drivers of change in the Insights industry
- The industry in Europe
- 2022 is pronounced “2020-too” for a reason
- Insights in Asia Pacific
- Evolution
- The insights industry in Latin America
- “The Price is Right” in 7 research projects
- Insights into Africa and the Middle East
- What makes for interesting investment
- Insights against chaos
- Is the insights industry too complex?
- What’s the lever for growth nowadays?
- European Union insights revenue reaches pre-pandemic levels
- K-shaped post-pandemic recovery of Asian Pacific insights
- Longer post-pandemic recovery for Latin American insights
- Long road for post-pandemic insights in Africa & Middle East
- A threat to the industry?
- The shifting impact of technology on the industry
- Human involvement in tech-intensive insights
- Possibilities and limitations, of unstructured data
- A future of hyperconnected insights platforms for enterprise-grade support
- The true cost of the “data rush”
- The importance of reinforcing self-brand connection
- The 2022 lattice of research methods
- Pandemic rebound through the eyes of research methodologies
- Growth in strategy and AdTech to outpace competition
- Shaping insights into impact