Who has the most developed insights industry?
ESOMAR presents in its 2021 IMDI ranking the countries with the most developed insights industry

Article series
Esomar Publications
- ESOMAR’s global top-25 insights companies
- Climate crisis
- Verdane: Investment in the Insights industry
- Who has the most developed insights industry?
- …What now? Pricing insights
- Drivers of change in the Insights industry
- The industry in Europe
- 2022 is pronounced “2020-too” for a reason
- Insights in Asia Pacific
- Evolution
- The insights industry in Latin America
- “The Price is Right” in 7 research projects
- Insights into Africa and the Middle East
- What makes for interesting investment
- Insights against chaos
- Is the insights industry too complex?
- What’s the lever for growth nowadays?
- European Union insights revenue reaches pre-pandemic levels
- K-shaped post-pandemic recovery of Asian Pacific insights
- Longer post-pandemic recovery for Latin American insights
- Long road for post-pandemic insights in Africa & Middle East
- A threat to the industry?
- The shifting impact of technology on the industry
- Human involvement in tech-intensive insights
- Possibilities and limitations, of unstructured data
- A future of hyperconnected insights platforms for enterprise-grade support
- The true cost of the “data rush”
- The importance of reinforcing self-brand connection
- The 2022 lattice of research methods
- Pandemic rebound through the eyes of research methodologies
- Growth in strategy and AdTech to outpace competition
- Shaping insights into impact
What is it?
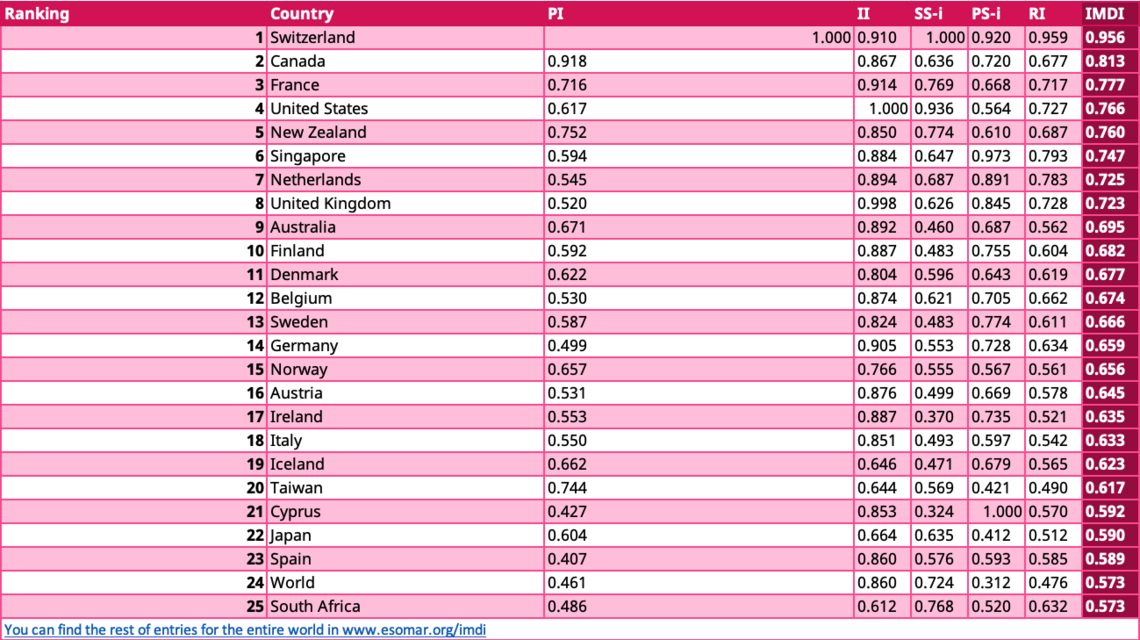
ESOMAR has ranked the world’s countries according to their development of the insights industry, using its Insights Market Development Index (IMDI). The precise inner workings of the IMDI can be found in the recently published report ESOMAR’s Insights Market Development Index for 2021, available to the public in www.esomar.org/IMDI. The IMDI is, to our knowledge, the only exercise in the world that systematically assesses several industry variables for each country to provide a comparable measure of the evolution of our sector across all of the countries measured. This article presents a summary of the findings, but ESOMAR intends to publish a more detailed paper elaborating on the elements of the ranking.
The IMDI combines data from more than 100 countries featured in the Global Market Research 2021 report, the countries included in the global index of prices published in the Global Prices Study 2021, and ESOMAR's data on global membership from over 130 countries and over 100 inter-association alliances. While the IMDI uses other metrics to fill in the gaps of non-participant countries, the goal is to represent each country in this ranking faithfully.
Basic workings of the IMDI
In brief, the IMDI combines three sub-indices: the prices index, the industry index, and the representation index.
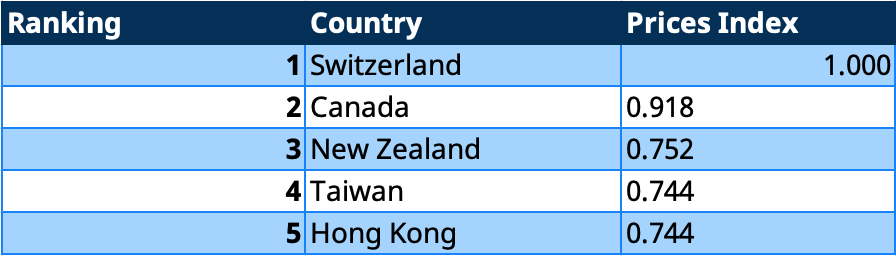
The prices index compares the price points of doing research across countries. For this calculation, the index extracts the information from the global ranking as reported by ESOMAR’s Global Prices Study 2021 and normalises it to the level of the USA. This allows us to compare it to the Purchase Power Parity index (PPP – as provided by the World Bank) for any countries who were unable to respond to the Prices Study since the PPP itself takes the USA dollar as the benchmark.
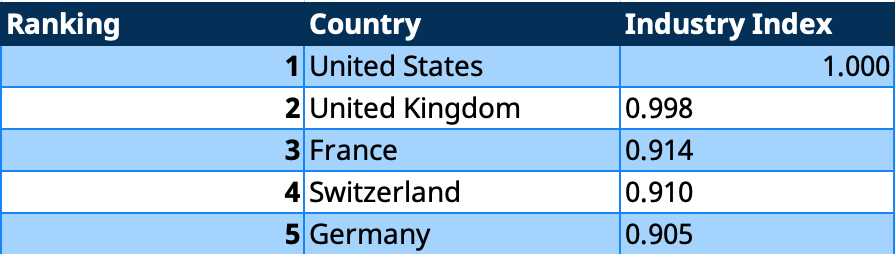
The industry index takes the turnover of the insights industry per capita adjusted by PPP and adds the compound net growth (after factoring in inflation) of the last two years to avoid circumstantial spikes or declines that may arise from isolated events.
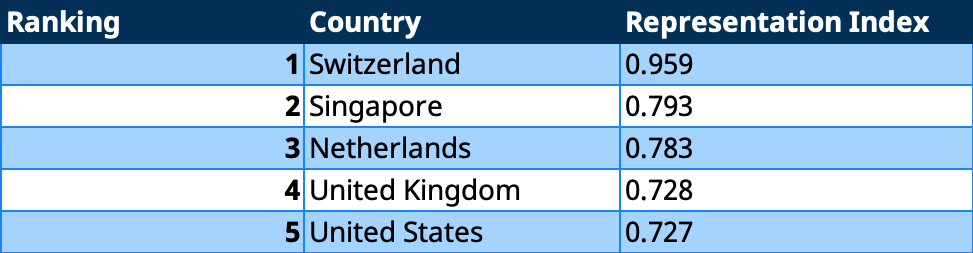
Lastly, the representation index absorbs the human element of the industry and its ethical commitment and results from the combination of two sub-indices: the specialisation index and the professional index.
The specialisation sub-index looks at the variety of professionals in the country. The rationale is that the industry benefits from a higher awareness of ethical and professional standards not only by agencies but also by their clients – since they are also increasingly scrutinised for the ethical behaviour of their providers.
The professional sub-index looks at the number of ESOMAR members per capita in a country and rewards countries that list a national association. Furthermore, the figure is enhanced if said association endorses the ICC/ESOMAR international code of professional standards, and even more if it adopts and enforces it.
A closer look at the indices
Prices are the result not only of the economic development of a country, but also of the level of development of the industry they refer to. For a more detailed look into what role prices play at a global level, please refer to ESOMAR’s Insights Market Development Index 2021 or to its Global Prices Study 2021. Switzerland and Canada appear to have substantially higher prices than the rest of the world, with scores above 0.9. The third most expensive country, New Zealand, comes at a distance from them, showing the near-outlier status of the first two.
The industry index looks at the presence of the industry in the country by normalising the turnover per capita in PPP adjusted by the country's 2-year net growth. At the top sits, perhaps unsurprisingly, the USA, followed by the UK. This result shows the effect the expansion in the industry's definition and its impact on turnover has had for these two countries. It is expected that similar assessments by countries down the ranking would boost their score in the Industry Index.
The representation index is built as the geometric average of the specialisation sub-index and the professional sub-index. The specialisation sub-index shows that our industry's inherent sensitivities require insights suppliers and insights buyers and users to remain mindful of proper practices to ensure that their internal insights and analytics divisions advocate for them, thereby preserving the excellence of the profession. The professional sub-index shows that countries in the highest places in the ranking present higher relative affiliation and well-established national associations.
Want to learn more?
The Insights Market Development Index 2021 is your compass to understand the state of insights and analytics markets worldwide!
Xabier Palacio
Head of Intelligence, Advocacy and Standards at EsomarXabier guides the creation of influential studies, reports, and guidelines at ESOMAR while overseeing the Departments of Professional Standards, Intelligence, and Public Affairs. He leads efforts to provide industry insights, maintain ethical standards, and advocate for the sector’s interests. ESOMAR, a global hub for research, insights, and analytics since 1947, supports over 50,000 professionals and companies worldwide. Under Xabier’s leadership, these departments ensure the industry’s continued growth, fostering collaboration and advocating for responsible practices with regulators and legislators.
Originally from Spain, Xabier has been living in the Netherlands for a number of years, where he studied a Master in International Economics followed by a Master in Marketing at the Erasmus University of Rotterdam. He is fluent in Spanish and English, has a decent command of Dutch, and loves music about as much as analysis.
Article series
Esomar Publications
- ESOMAR’s global top-25 insights companies
- Climate crisis
- Verdane: Investment in the Insights industry
- Who has the most developed insights industry?
- …What now? Pricing insights
- Drivers of change in the Insights industry
- The industry in Europe
- 2022 is pronounced “2020-too” for a reason
- Insights in Asia Pacific
- Evolution
- The insights industry in Latin America
- “The Price is Right” in 7 research projects
- Insights into Africa and the Middle East
- What makes for interesting investment
- Insights against chaos
- Is the insights industry too complex?
- What’s the lever for growth nowadays?
- European Union insights revenue reaches pre-pandemic levels
- K-shaped post-pandemic recovery of Asian Pacific insights
- Longer post-pandemic recovery for Latin American insights
- Long road for post-pandemic insights in Africa & Middle East
- A threat to the industry?
- The shifting impact of technology on the industry
- Human involvement in tech-intensive insights
- Possibilities and limitations, of unstructured data
- A future of hyperconnected insights platforms for enterprise-grade support
- The true cost of the “data rush”
- The importance of reinforcing self-brand connection
- The 2022 lattice of research methods
- Pandemic rebound through the eyes of research methodologies
- Growth in strategy and AdTech to outpace competition
- Shaping insights into impact